

Thank you for visiting CGS! You are currently using CGS' legacy site, which is no longer supported. For up-to-date information, including publications purchasing and meeting information, please visit cgsnet.org.
Although many of the recommendations for improving doctoral completion focus on the actions of the doctoral programs themselves, a university’s administration can also serve a valuable role in several ways.
Administration Must Be Proactive
First, administrators should be proactive in addressing both the cross-disciplinary aspects of doctoral study and the unique needs of doctoral education on their campus. For example, it was necessary for the Graduate School to develop our own theoretical framework, based on an analysis of the literature, prior to implementing other research activities. The framework, The Four Conditions for Optimal Doctoral Completion, is described on our website (the Theoretical Framework page). Once it was formulated, it served as the framework for all activities of the project and as a basis for a self-study of our doctoral programs. The Graduate School led this internal examination, which involved compiling completion statistics, conducting student and faculty interviews, and examining current program-level practices and policies with respect to doctoral education.
Another way for administrators to be proactive is by educating doctoral programs about the importance of doctoral completion. Additionally, administration must provide programs with information regarding the best program-level practices for facilitating doctoral completion. In particular, the focus of these targeted efforts must be on faculty, as they have real power and authority to effect program-level change. At the Graduate School, this involved raising awareness, communicating research findings, and providing individualized support through conferences, meetings, publications, and a program website.
At the University of Georgia, the Graduate School implemented several activities in order to promote awareness. First, we developed a website for both the Strategic Intervention for Doctoral Completion project and the Initiative for Optimal Doctoral Completion, which are both housed at www.grad.uga.edu/cgs. Through this website, we have communicated our research with faculty and students through research briefs and strategy sheets on the Project Publications page. The website also provides links to other research on the topic of doctoral completion on the Resources page. It also includes a Problem-Solving Forum, which allows doctoral students and faculty to provide suggestions to typical problems of doctoral study in an interactive manner.
Second, the Graduate School hosted two regional conferences and one university-wide conference in the past four years to further educate faculty leaders in doctoral programs about completion trends. At these conferences, faculty leaders were provided with completion statistics on how their programs were doing compared to university and national norms. Additionally, we also promoted interactive discussion groups at the conferences, as a method for program leaders to communicate and exchange innovative ideas and facilitate discussion. Research findings, with links to practical implications for improving completion rates, also were disseminated to program leaders at the conferences. More conference information can be found on our website (www.grad.uga.edu/cgs on the Conferences page).
Third, the research team at the Graduate School presented this study’s findings through various forms of scholarship. Research briefs, based on the student and faculty interviews, contain results relating to each of the conditions in the theoretical framework. Strategy sheets, based on a culmination of our own studies as well as that of others, suggest program practices and policies that promote doctoral completion. Several members of our research team went on to present our findings at national and regional conferences. Copies of publications and presentations were also provided to our faculty at a university-wide conference, and are on our website (www.grad.uga.edu/cgs on the Project Publications page).
Fourth, in January of 2008, we launched a public awareness campaign. This campaign involved press releases and articles in campus newspapers. We chose this method of dissemination in order to communicate our Initiative to a wider audience.
Once all faculty are educated about the importance of doctoral completion, the Graduate School must collaborate with doctoral programs in order to best serve doctoral students. One of the most effective methods that we have implemented is to ensure administration and/or the research team at the Graduate School is available for assisting individual doctoral programs at our own university. When needed, Dean Maureen Grasso met with program leaders from the original twelve participating programs in order to establish where each program was in terms of completion rates. Additionally, Dean Grasso worked collaboratively with program leaders to develop program goals that target at least one of The Four Conditions for Optimal Doctoral Completion. Last, the Graduate School must offer resources and recommendations for specific and universal problems that doctoral programs may encounter, which will be discussed in detail in the subsequent chapters.
Finally, data also served a powerful role. In working closely with faculty on this issue at the three partner institutions over the past four years, it was our experience that faculty were often resistant to administrative mandates for program-level change. Gradually, based on comments gathered at conferences, meetings, during the research interviews and through correspondence, faculty rightfully felt a sense of ownership for their own program and its policies. Many faculty members were hesitant to change when the suggestions came directly from the administration. Additionally, many faculty members stressed the uniqueness of their particular doctoral program, wherein they felt some of the suggested policies would not work for their own program.
Rather than declaring administrative mandates for change, we found that data motivated faculty members to consider the need for program improvements. Data on doctoral completion was especially powerful when completion rates offered comparisons to similar programs. Faculty members typically wanted their programs to be as good as or better than comparable programs at other universities.
We decided that the best method both for promoting awareness and facilitating faculty “buy-in” and support was to utilize data as an important driver for fostering change. The following five-step plan for using data to innervate program-level change was developed:
1. Collect appropriate data.
2. Distill data to allow for meaningful program comparisons.
3. Provide data to allow for public comparisons.
4. Review data with program leaders.
5. Encourage program leaders to develop their own plans for program-level change using The Four Conditions for Optimal Doctoral Completion.
1. Collect the appropriate data.
Step 1 involves collecting appropriate doctoral completion data in order to promote more awareness on this issue. The Graduate School collaborated with our university’s Institutional Research department in order to collect the necessary data. The CGS templates were used to examine attrition and completion statistics. In addition to the CGS templates, we also provided faculty with data that highlighted the doctoral completion rates of their programs in order to alert them of their respective ranking and promote program-level change.
As an aside, it was important for us to develop a retinue of operational definitions for each variable involved, for several reasons. Since research teams at both the Graduate School and the department of Institutional Research were working with the data, miscommunication in how to calculate a statistic could drastically change the outcome. For example, we noted a discrepancy regarding when a student was considered a Ph.D. student, if he or she earned a Master's en route. Using the the original enrollment date, or the date after which the Master's degree was earned instead, would significantly change the median Time-to-Degree or Time-to-Withdrawal statistics.
2. Distill data to allow for meaningful program comparisons.
Step 2 involved providing data that easily allowed faculty to make meaningful comparisons to similar programs and across universities. In our experience, the most useful data were statistics that were comparable across disciplines, and able to be compared to other universities. The Percent Completion statistic is the percentage of students in the program that earned a Ph.D. The final Percent Completion statistic for a program includes all cohorts in the program ten years after initial enrollment, which should have allowed ample time to complete a degree. The Time-to-Degree statistic is the number of years Ph.D. completers took to earn their degree after initial enrollment. The Time-to-Withdrawal statistic was also included to determine when most non-completers dropped out of their programs. These statistics are available to faculty at www.grad.uga.edu/cgs under the Program Data page. The programs also received a statistical report of their own program's findings.
It is also important to note that we believed faculty needed direct access to data findings from our research. In particular, findings from the Program Practices Study were made available to faculty at the three institutions. These data promoted awareness so that programs could consider other innovation ideas than those already in place at their institution. Additionally, findings and conclusions from the interviews allowed faculty to examine more broadly the perceptions of doctoral students and other faculty members. More importantly, both data sets led to the development of research briefs and strategy sheets that recommend effective practices for improving doctoral completion. These resources can be found at www.grad.uga.edu/cgs under the Project Publications page.
3. Provide data to allow for public comparisons.
Step 3 involved encouraging program leaders to compare their data with benchmarks from similar programs. Faculty were particularly open to data which helped them determine their standing relative to the same program at other universities, in similar disciplines, and in all disciplines at their own and other universities. Three methods for examining their data were offered.
First, faculty could examine their benchmark statistics, in order to compare their own data to all programs at the three universities, and within each university. A ranking of each program allowed faculty to compare their program’s completion rates (Table 2) and Time-to-Degree (Table 3) statistic to others. The tables below are examples of the data at the University of Georgia, but the program names have been concealed. These completion and Time-to-Withdrawal Statistics were available to faculty online (www.grad.uga.edu/cgs under the Program Data page).
Table 2
Completion Rankings of 11 Programs at the UGA
|
Program (n) |
% Complete |
Rank |
|
Program 1 (34) |
72.7 |
1 |
|
Program 2 (115) |
67.6 |
2 |
|
Program 3 (12) |
66.7 |
3 |
|
Program 4 (58) |
65.3 |
4 |
|
Program 5 (27) |
62.5 |
5 |
|
Program 6 (70) |
59.4 |
6 |
|
Program 7 (27) |
55.6 |
7 |
|
Program 8 (18) |
47.1 |
8 |
|
Program 9 (16) |
43.8 |
9 |
|
Program 10 (18) |
37.5 |
10 |
|
Program 11(36) |
33.3 |
11 |
Table 3
Time-to-Degree Rankings of 11 Programs at the UGA
|
Program (n) |
TTD |
Rank |
|
Program 1 (16) |
3.33 |
1 |
|
Program 2 (70) |
4.33 |
2 |
|
Program 3 (12) |
4.67 |
3 |
|
Program 4 (115) |
4.67 |
4 |
|
Program 5 (18) |
4.67 |
5 |
|
Program 6 (18) |
5.33 |
6 |
|
Program 7 (34) |
5.33 |
7 |
|
Program 8 (27) |
5.33 |
8 |
|
Program 9 (58) |
6.00 |
9 |
|
Program 10 (36) |
6.00 |
10 |
|
Program 11 (27) |
6.00 |
11 |
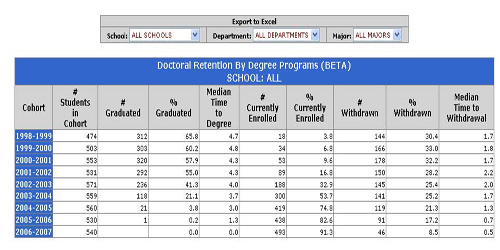
Second, the Graduate School worked collaboratively with Institutional Research to develop a drillable database for all of the University of Georgia’s doctoral programs. This database allows faculty to examine graduation, enrollment, and withdrawal trends for each cohort. As can be seen below, the faculty have the option to examine university-wide data or explore the data by college, department, or program. Faculty can access these data with their “MyID” and password (https://facts.oir.uga.edu/facts/Retention.cfm).
Example of Drillable Database
Third, in the Initiative for Optimal Doctoral Completion, the faculty were given access to benchmarks comparing the Completion Rate, Withdrawal Rate, Time-to-Degree, and Time-to-Withdrawal Statistics of all doctoral programs at the University of Georgia. Benchmarks enabled faculty members to compare their program’s data with other programs in the university. It is important to note that the Graduate School did not categorize the statistics (e.g., Average, Above Average, Below Average, etc.) so that each program could determine their standing as it relates the overall distribution of these statistics and their program’s goals in each area. Tables 4, 5, 6, and 7 contain examples of benchmark information for the Completion Rate, Time-to-Degree, Withdrawal Rate, and Time-to-Withdrawal Rate, respectively. It is important to note that university-wide normative benchmarks are still in development at the University of Georgia.
Table 4: Completion Rate Benchmarks at the UGA
|
Benchmark |
Completion |
|
Highest 1/5 |
>92.02 |
|
4/5 |
70.67-92.02 |
|
3/5 |
57.20-70.66 |
|
2/5 |
43.10-57.10 |
|
Lowest 1/5 |
<43.20 |
Table 5: Time-to-Degree Benchmarks at the UGA
|
Benchmark |
TTD (Years) |
|
Highest 1/5 |
<3.67 |
|
4/5 |
3.67-4.32 |
|
3/5 |
4.33-4.99 |
|
2/5 |
5-5.99 |
|
Lowest 1/5 |
>5.99 |
Table 6: Withdrawal Rate Benchmarks at the UGA
|
Benchmark |
Withdrawal (%) |
|
Highest 1/5 |
<7.98 |
|
4/5 |
7.99-25.00 |
|
3/5 |
25.1-36.3 |
|
2/5 |
36.4-50 |
|
Lowest 1/5 |
>50 |
Table 7: Time-to-Withdrawal Benchmarks at the UGA
|
Benchmark |
TTW (Years) |
|
Highest 1/5 |
<0.67 |
|
4/5 |
0.67-1.32 |
|
3/5 |
1.33-1.99 |
|
2/5 |
2-3.52 |
|
Lowest 1/5 |
>3.53 |
4. Review data with program leaders.
After program leaders become aware of their data and review the findings with faculty members in their program, graduate school administrators must continue to be proactive in order to encourage program-level change. At the University of Georgia, the Graduate School Dean met individually or in small groups with each program leader from the participating programs in the Strategic Intervention for Doctoral Completion project. Faculty responses ranged from ignorance of their program’s statistical data, to prior full awareness of completion rates. However, we believe that the review meetings motivated program leaders beyond the point of mere awareness of their completion status, and prompted actions addressing program improvements.
5. Encourage program leaders to develop their own plans for program-level change.
The program leaders were asked the following three questions by the Dean of the Graduate School during their review:
In Step 5, the program leaders were asked to develop their own plans for program-level improvements with the aim of increasing the Completion Rate as well as decreasing the Time-to-Degree, Time-to-Withdrawal, and Withdrawal Rate statistics for the current cohorts. Although program leaders began developing their plans while meeting with the Dean of the Graduate School, they also were asked to collaborate with other faculty members in their program in order to foster further faculty "buy-in" when developing specific plans. After working with other faculty members, program leaders were asked to submit in writing their plans for improvement in each of the four rated areas. One year later, programs submitted a written update regarding their progress in each area.
Specifically, the first question prompted faculty not to "settle" with their current Completion and Time-to-Degree statistics, what ever they were at the time. Question two allowed the Dean of The Graduate School to document what program policies, practices, and programs were already in place. The final question resulted in an action plan for their program for improving doctoral completion by each program leader, categorized according to The Four Conditions for Optimal Doctoral Completion.
Administration Must Serve in a Supportive Role
In addition to providing proactive leadership concerning the university’s unique needs and more universal needs related to doctoral completion, administrators must also serve in a supportive role to facilitate program-level change. The Graduate School had two primary objectives in delineating their supportive role. First, it was essential to communicate findings from the research literature as well as our own research studies to program leaders. In many cases, programs were more open to learning more about their own program’s completion statistics and information from their peers than from the literature. The rationale was, What does this mean for my program? Additionally, programs welcomed information about empirically-supported program practices. Second, a primary goal of this study was to encourage doctoral faculty to systematically monitor their program’s policies and practices related to doctoral completion. Our research team understood that doctoral faculty knew their own programs best and knew which of the empirically-based practices were realistic for their program. We found that encouraging program-level interventions promoted awareness and faculty buy-in for increasing completion rates.
In addition to promoting awareness regarding the issues of doctoral completion as well as research-based program practices, the graduate school administrators should encourage faculty members continuously to improve program-level practices through systematic experimentation. Our research team developed several resources for programs to use for the assessment and improvement of their practices. Each of these resources was given to the participating programs during this study.
It is important to note that financial support for both students and departments can be an important issue in doctoral education; however, it was not evaluated in The Four Conditions for Optimal Doctoral Completion theoretical framework. The idea instead was to focus faculty attention on the four conditions and encourage program-level self-study and change. While understanding that money is important, we wanted to facilitate true change and, thus, encourage faculty to work within their existing resources.
Faculty Discussion Guide
Faculty Discussion Guide was given to each of the thirty-seven participating programs at the beginning of our research grant in 2004. The faculty were asked to use the Discussion Guide to gauge current practices of each of our participating programs. Additionally, the document promoted awareness about doctoral completion and provided a script by which faculty could discuss the topic. The Guide was derived from The Four Conditions for Optimal Doctoral Completion framework.
Program Self-Assessment
The Program Self-Assessment document was designed as a tool to enable programs to plan their interventions aligned with each of The Four Conditions for Optimal Doctoral Completion. Faculty in each participating program list their goals for each of the four conditions and specific planned interventions corresponding to each goal. Additionally, the faculty also denote a timeline for each of the interventions. Annual Self-Assessments as stipulated in the document allow for a systematic approach for measuring progress.
Program Self-Study Guide
The Program Self-Study Guide offers programs to systematically monitor their progress and interventions. This checklist format included in the Guide is derived from the literature on doctoral completion as well as our findings from the Program Practices Study, Program Self-Assessments, and interviews with doctoral students and faculty. The Self-Study enables programs to identify their strengths and opportunities for improvement. Drawn from The Four Conditions for Optimal Doctoral Completion, the Guide contains empirically-supported recommendations categorized by each condition. Doctoral programs are encouraged to utilize this resource periodically so that faculty can assess their program and construct an intervention plan for improving completion rates.
![]()