

Thank you for visiting CGS! You are currently using CGS' legacy site, which is no longer supported. For up-to-date information, including publications purchasing and meeting information, please visit cgsnet.org.
(Reprinted from the April 2011 issue of the CGS Communicator)
For more than 25 years, the Council of Graduate Schools, in partnership with the Graduate Record Examinations (GRE) Board, has collected and published data on graduate enrollment and degrees in U.S. colleges and universities (Council of Graduate Schools, 2010). Similar data are published by the Canadian Association for Graduate Studies for institutions in Canada (Canadian Association for Graduate Studies, 2011). While differing definitions and methodologies prevent exact comparisons between the two sources, the data illuminate some similarities as well as some differences in the graduate student populations of the U.S. and Canada.
One major difference between graduate enrollment in the U.S. and in Canada is the size of the graduate student population. Graduate enrollment in the U.S. is more than ten times larger than graduate enrollment in Canada. Institutions responding to the CGS/GRE Survey of Graduate Enrollment and Degrees reported enrolling a total of nearly 1.75 million students in U.S. graduate programs in 2008. In contrast, graduate enrollment in Canada totaled about 172,000 students in that same year.
Graduate enrollment is increasing slightly faster in Canada than in the U.S. Since 1999, graduate enrollment has grown by 5.3% annually on average in Canada, compared with a 3.7% average annual increase in the U.S.
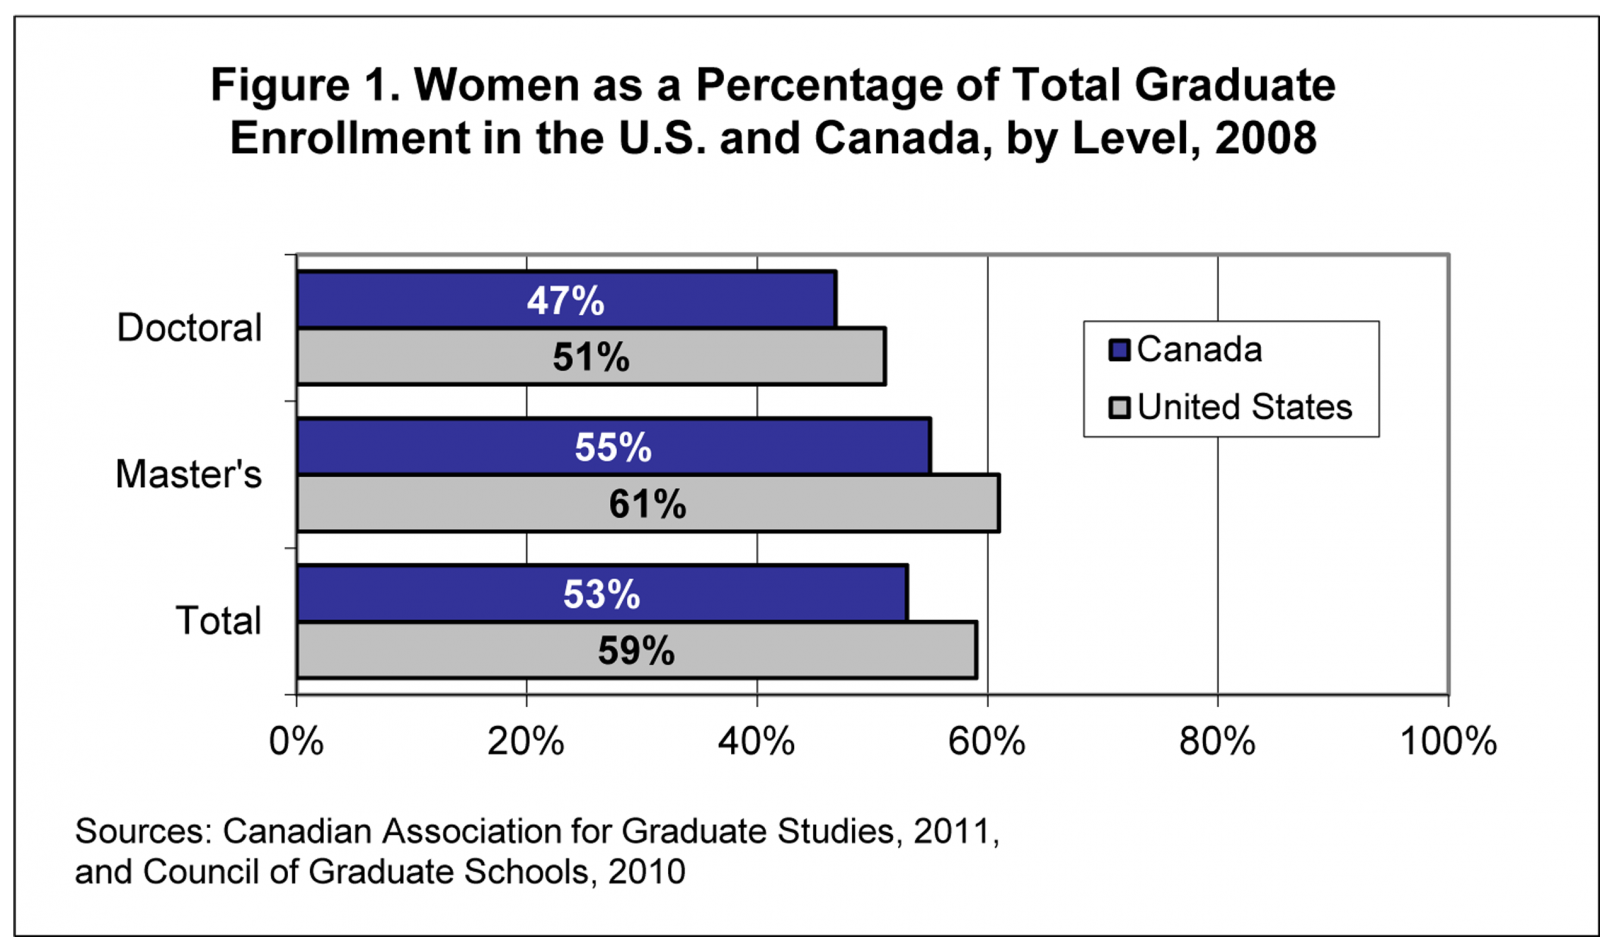
In both the U.S. and Canada, the majority of all graduate students are women. In 2008, women comprised 59% of all U.S. graduate students and 53% of all Canadian graduate students (see Figure 1). In both countries, women accounted for a larger share of master’s enrollment than doctoral enrollment. In the U.S., 61% of all students enrolled in master’s programs in 2008 were women, and 51% of doctoral enrollees were women. Similarly, in Canada women comprised 55% of master’s enrollees and 47% of doctoral enrollees in 2008. The share of women in graduate enrollment is on the rise in both the U.S. and Canada, increasing from 55% in 1999 to 59% in 2008 in the U.S. and from 50% to 53% in Canada over the same time period.
International students comprise a similar share of graduate enrollment in the U.S. and in Canada. In 2008, 16% of all graduate students in U.S. institutions were international, while in Canada, about 15% were international. In both countries, international students are more likely to be enrolled in science and engineering and business fields than in arts and humanities fields. The international student population in both countries increased as a share of total graduate enrollment between 1999 and 2008, but growth in Canada outpaced growth in the U.S. The international share of graduate enrollment increased from about 15.5% to 16% in the U.S. between 1999 and 2008, compared with a gain from 12% to 15% in Canada over the same time period.
International students at Canadian institutions are most likely to be from countries in Eastern and Southern Asia. At the master’s level in Canada, 3.1% of all students come from Eastern Asia and 2.0% from Southern Asia. At the doctoral level, 3.8% come from Southern Asia and 3.4% from Eastern Asia. While the CGS/GRE Survey of Graduate Enrollment and Degrees does not collect data on country of origin for international students attending institutions in the U.S., data from the CGS International Graduate Admissions Survey show that about half of all international students at U.S. graduate schools are from China, India, and South Korea (Bell, 2010), indicating the importance of students from Asian countries to the graduate school populations of both countries.
Graduate students in the U.S. are more likely to be enrolled part-time than graduate students in Canada. In 2008, 45% of all U.S. graduate students were enrolled part-time, compared with 26% of Canadian graduate students. In both countries, graduate students in education were among the most likely to be enrolled part-time.
In both the U.S. and Canada, the majority of all graduate degrees awarded each year are master’s degrees. In Canada, about 36,500 master’s degrees were awarded in 2008, compared with 5,400 doctorates. In the U.S., institutions responding to the CGS/GRE Survey of Graduate Enrollment and Degrees reported awarding over 488,000 master’s degrees in 2008, compared with about 56,000 doctorates.
In the U.S., education and business were the largest broad fields at the master’s level in 2008, accounting for 29% and 23%, respectively, of the master’s degrees awarded that year. In Canada, the largest broad field was business, management and public administration, accounting for 29% of all master’s degrees in 2008. The field of education is much smaller in Canadian institutions, with just 11% of all master’s degrees in 2008 awarded in that broad field.
At the doctoral level in the U.S., engineering and physical sciences were the largest broad fields, each accounting for about 15% of all doctorates awarded that year. In Canada, the broad field of physical and life sciences accounted for the largest share of doctorates awarded in 2008 (26%), followed by architecture, engineering, and related technologies (19%). While there are differences in the taxonomies used in the two data sources, the broad fields of engineering and physical sciences account for a large portion of the doctorates awarded each year in both Canada and the U.S.
While the size of graduate education in the U.S. dwarfs that of Canada, both countries have similar percentages of international students and similar trends in the participation of women in graduate education. They also share some similarities in the fields of study that comprise the majority of the graduate degrees awarded and the countries of origin of their international graduate students. And Canada and the U.S. have both experienced an increase in graduate enrollment over the past decade. The two data sets examined in this article, while not directly comparable, clearly document some shared trends in graduate education and highlight the value placed on graduate education in both Canada and the U.S.
By Nathan E. Bell, Director, Research and Policy Analysis
References
Bell, N.E. (2010). Findings from the 2010 CGS International Graduate Admissions Survey, Phase III: Final Offers of Admission and Enrollment. Washington, DC: Council of Graduate Schools.
Canadian Association for Graduate Studies. (2011). 39th Statistical Report: 1999-2008. Ottawa, ON: Canadian Association for Graduate Studies.
Council of Graduate Schools. (2010). CGS/GRE Survey of Graduate Enrollment and Degrees. Dataset.
![]()