You are on CGS' Legacy Site.
Thank you for visiting CGS! You are currently using CGS' legacy site, which is no longer supported. For up-to-date information, including publications purchasing and meeting information, please visit cgsnet.org.
(Reprinted from the July 2011 issue of the CGS Communicator)
According to data from the American Community Survey, about 6% of the U.S. population ages 5 to 20 and 13% of the U.S. population ages 21 to 64 had a disability in 2007 (U.S. Census Bureau, 2011a and 2011b). Data on the participation of individuals with disabilities in graduate education is not as widely disseminated as data on graduate enrollment by other student characteristics, such as gender, citizenship, and race/ethnicity, but some data do exist to shed light on this topic.
One somewhat unlikely source of information on graduate students with disabilities is the National Postsecondary Student Aid Study (NPSAS). The main purpose of the NPSAS is to examine how students finance their education, but the survey data can also provide estimates of graduate enrollment by student characteristics, including disability status. The NPSAS defines a disability as a condition such as blindness; deafness; severe vision or hearing impairment; substantial limitation of one or more basic physical activities such walking, climbing stairs, reaching, lifting, or carrying; or any other physical, mental, emotional, or learning condition that lasts six months or more.
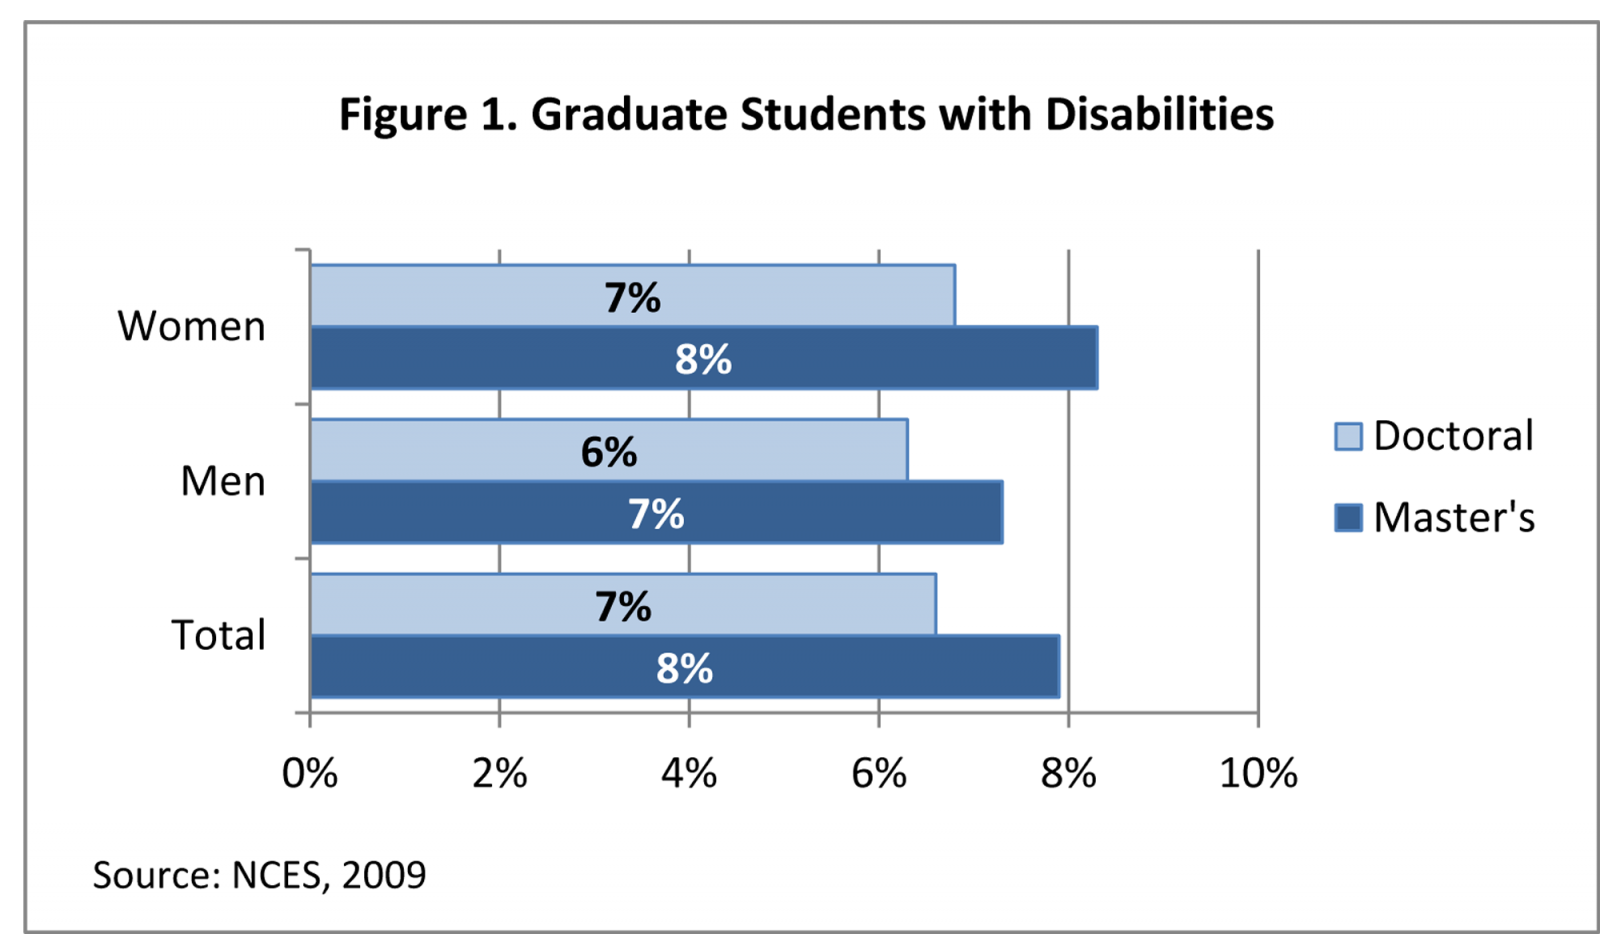
According to data from the most recent NPSAS, about 8% of master’s students and 7% of doctoral students in academic year 2007-08 had some type of disability (NCES, 2009). At both the master’s and doctoral levels in 2007-08, women were slightly more likely than men to report having a disability—8% vs. 7% at the master’s level and 7% vs. 6% at the doctoral level, as shown in Figure 1.

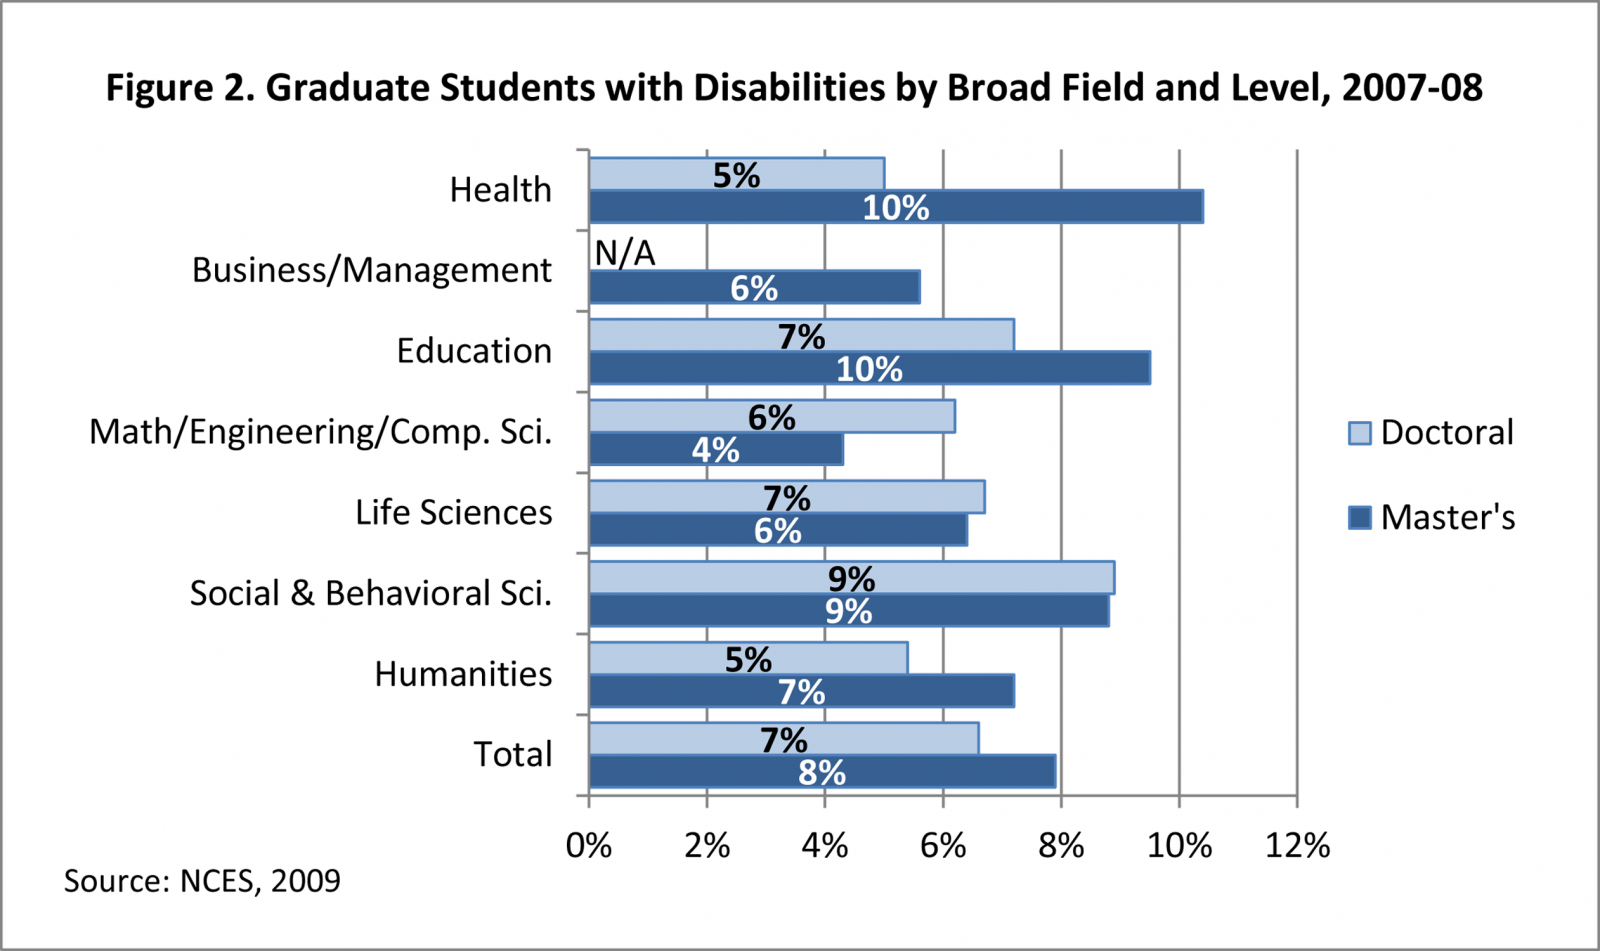
The NPSAS data also show that the percentage of graduate students who reported having some type of disability in academic year 2007-08 varied by broad field. At the master’s level, students enrolled in mathematics, engineering, and computer science were least likely to report having a disability (4%), while master’s students in the broad fields of health and education were most likely to report having a disability (both 10%), as shown in Figure 2. At the doctoral level, 5% of students in the broad fields of health and humanities reported having some type of disability, compared with 9% of doctoral students in social and behavioral sciences. Data for business/management at the doctoral level were suppressed due to the small sample size.

In addition to showing the percentage of students with a disability by broad field, the NPSAS data also illustrate the distribution of students with and without disabilities across broad fields. In most cases, the distributions were very similar in 2007-08, with students with and without disabilities being distributed in similar shares across most broad fields of study. For example, at the master’s level, 8% of all students with disabilities and 7% of all students without disabilities were enrolled in social and behavioral sciences. Similarly, 14% of all doctoral students with disabilities, as well as 14% of all doctoral students without disabilities, were enrolled in life sciences. But, there were some cases in which the distributions varied. At the master’s level, students with disabilities were more likely to be in education than their counterparts without disabilities; 35% of all master’s students with disabilities were enrolled in education in 2007-08 compared with 29% of all master’s students without disabilities. In contrast, master’s students with disabilities were less likely to be in business/management than students without disabilities (18% vs. 25%). At the doctoral level, students with disabilities were more likely to be enrolled in social and behavioral sciences then students without disabilities (19% vs. 13%).
A second source of data on graduate students with disabilities is the annual Survey of Earned Doctorates (SED), which is administered to recipients of research doctorates in the United States. In its definition of disability, the SED includes blindness/visual impairment, physical/orthopedic disability, deafness/hard of hearing, learning/cognitive disability, vocal/speech disability, and other/unspecified disabilities. According to the SED, 1.5% of all doctorate recipients in 2009 reported having one or more disabilities of any type (National Science Foundation, 2010). This percentage is considerably lower than the NPSAS estimate of the percentage of doctoral enrollees with disabilities, but it is important to note that the populations and methodologies of the two surveys are very different, which might explain the difference between the two figures. First, the SED only collects data on recipients of research doctorates, while the NPSAS includes in its estimate students enrolled in all doctoral programs, including practice-oriented programs such as the Psy.D., DPT and Ed.D. In addition, the response rate for the SED is typically in the 90-95% range each year, while the NPSAS is a sample survey based on a much smaller subset of doctoral students and therefore is subject to sampling errors. Finally, the SED reports data on doctorate recipients while the NPSAS surveys doctoral enrollees. While it is possible that there are differences in completion rates between students with and without disabilities which could result in students with disabilities comprising a higher share of enrollees than degree recipients, the available datasets are unable to indicate whether this is the case.
The SED provides disaggregated data by field of study and student demographics. By broad field of study, the percentage of doctorate recipients with one or more disabilities of any type ranged from a low of 0.7% in engineering to a high of 2.6% in education. By gender, 1.3% of male doctorate recipients and 1.6% of female doctorate recipients reported a disability. And by citizenship, U.S. citizen and permanent resident doctorate recipients were more likely than temporary visa holders to report having a disability – 2.1% vs. 0.4%.
The National Science Foundation also publishes the most accessible, albeit somewhat narrowly focused, source of data on individuals with disabilities, Women, Minorities, and Persons with Disabilities in Science and Engineering (National Science Foundation, 2011). This online data compendium is updated biennially and includes data tables on scientists and engineers with disabilities and graduate students in science and engineering with disabilities, relying on the SED and the NPSAS as data sources. While the data tables focus only on science and engineering, they provide more detailed data on disabilities than other reports based on the SED and do so in a more user-friendly format than the NPSAS.
Although the figures vary between the two sources, the SED and the NPSAS provide some information on the participation of students with disabilities in graduate education. Regardless of the data source, the scope of that participation highlights the importance of addressing the varied and unique barriers that students with disabilities face in their pathways to and through graduate school.
By Nathan E. Bell, Director, Research and Policy Analysis
References
National Center for Education Statistics (NCES). 2009. 2007-08 National Postsecondary Student Aid Study (NPSAS:08). Dataset.
National Science Foundation. 2010. Doctorate Recipients from U.S. Universities: 2009. Retrieved from www.nsf.gov/statistics/nsf11306/nsf11306.pdf
National Science Foundation. 2011. Women, Minorities, and Persons with Disabilities in Science and Engineering: 2011. Retrieved from www.nsf.gov/statistics/wmpd/
U.S. Census Bureau. 2011a. “R1801. Percent of People 5 to 20 Years Old With a Disability.” Retrieved from http://factfinder.census.gov
U.S. Census Bureau. 2011b. “R1802. Percent of People 21 to 64 Years Old With a Disability.” Retrieved from http://factfinder.census.gov


