

Thank you for visiting CGS! You are currently using CGS' legacy site, which is no longer supported. For up-to-date information, including publications purchasing and meeting information, please visit cgsnet.org.
(Reprinted from the March 2011 issue of the CGS Communicator)
Through the Current Population Survey (CPS), a monthly sample survey of approximately 60,000 households across the United States, the U.S. Census Bureau and the Bureau of Labor Statistics (BLS) collect data on the education level of the U.S. population and the income of employed individuals. The findings from the 2010 CPS surveys confirm that individuals with advanced degrees continue to earn more on average than individuals with lower levels of educational attainment.
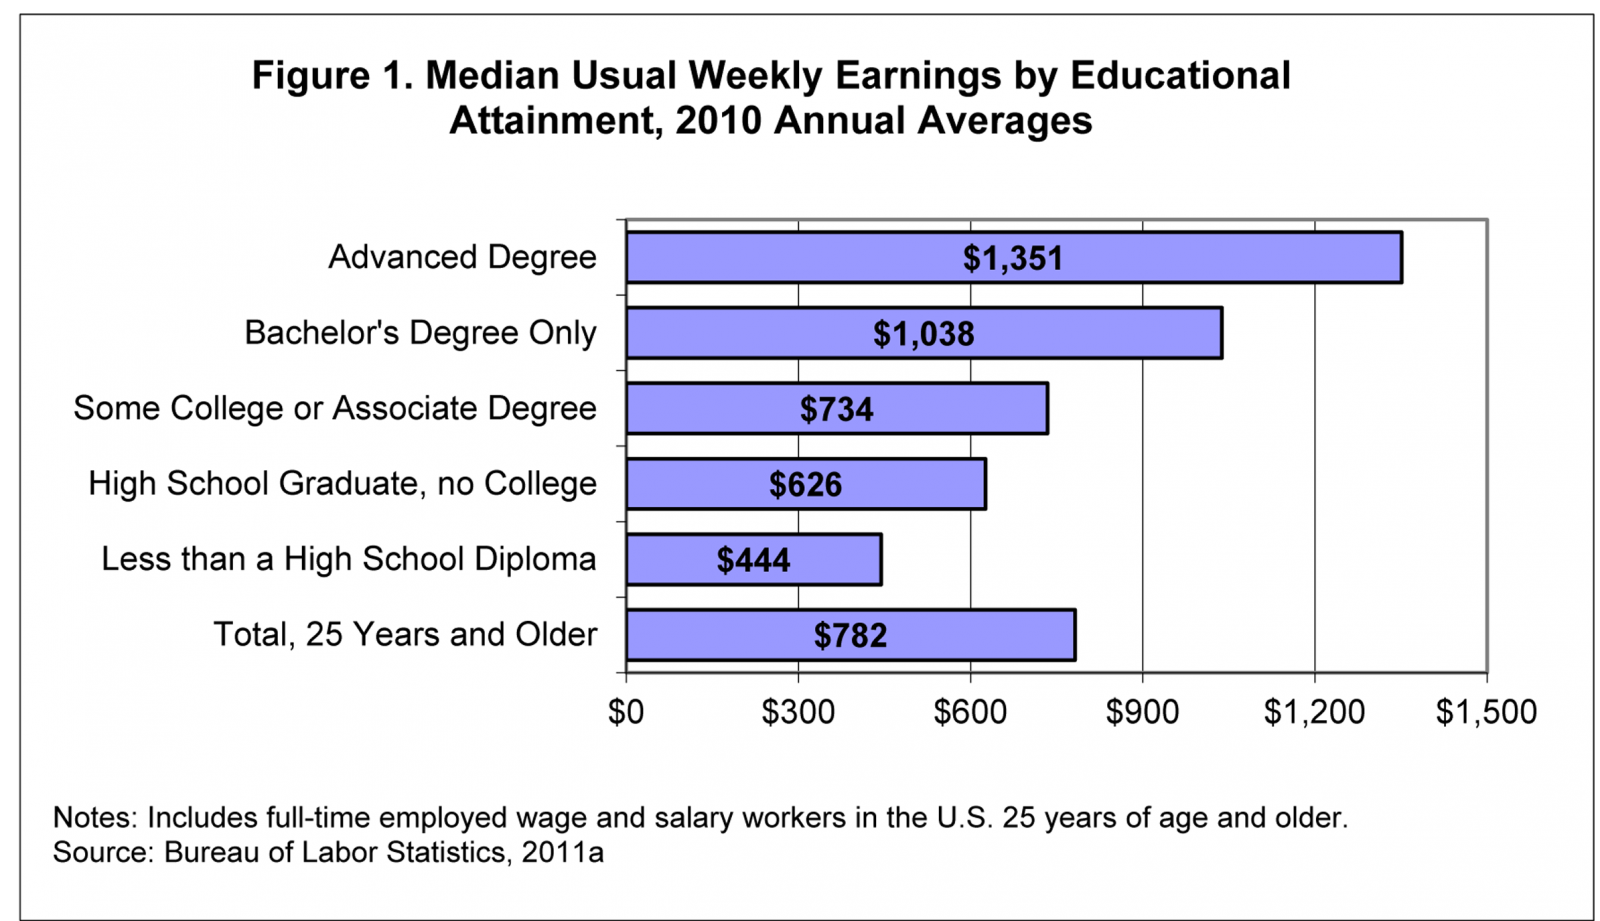
In 2010, among full-time employed wage and salary workers 25 years of age and older, the median usual weekly earnings of individuals with advanced degrees (master’s degrees, doctorates, or first-professional degrees) were $1,351 (Bureau of Labor Statistics, 2011a). This compares with median usual weekly earnings of $1,038 for individuals with a bachelor’s degree as their highest degree and $626 for individuals with only a high school diploma (see Figure 1). This wage premium means that individuals with advanced degrees earned 30% more in 2010 than individuals with a bachelor’s degree as their highest degree and more than twice as much as individuals with only a high school diploma. Overall, the median usual weekly earnings of all wage and salary workers 25 years of age and older was $782.
While advanced degree holders earned a median $1,351 per week in 2010, there were large differences by gender and race/ethnicity. Overall, men with advanced degrees earned about 34% more than women with advanced degrees – $1,552 for men versus $1,158 for women (Bureau of Labor Statistics, 2011a). By race/ethnicity, Asian and white workers with advanced degrees earned more than their Hispanic/Latino and Black/African American counterparts (see Table 1). Median usual weekly earnings ranged from a high of $1,466 for Asian workers to a low of $1,065 for Black/African American workers. Within every race/ethnicity category, men earned more than women (see Table 1). White men earned about 35% more than white women, and Hispanic/Latino men earned about 23% more than Hispanic/Latino women. Black/African American men also earned more than Black/African American women, but the wage premium was smaller than in other race/ethnicity categories, with Black/African American men earning 16% more than Black/African American women. Among all workers with advanced degrees, Black/African American women had the lowest median weekly earnings at $1,010, and white men had the highest median weekly earnings at $1,552, about 54% more than the median weekly earnings of Black/African American women.

Among advanced degree holders, the wage premium for men has remained relatively constant over the past decade. In 2000, the median usual weekly earnings of men were 33% higher than the median usual weekly earnings of women – $1,172 versus $881 (Bureau of Labor Statistics, 2011b). A decade later in 2010, men with advanced degrees earned 34% more than women with advanced degrees as noted above, virtually the same wage premium as in 2000.
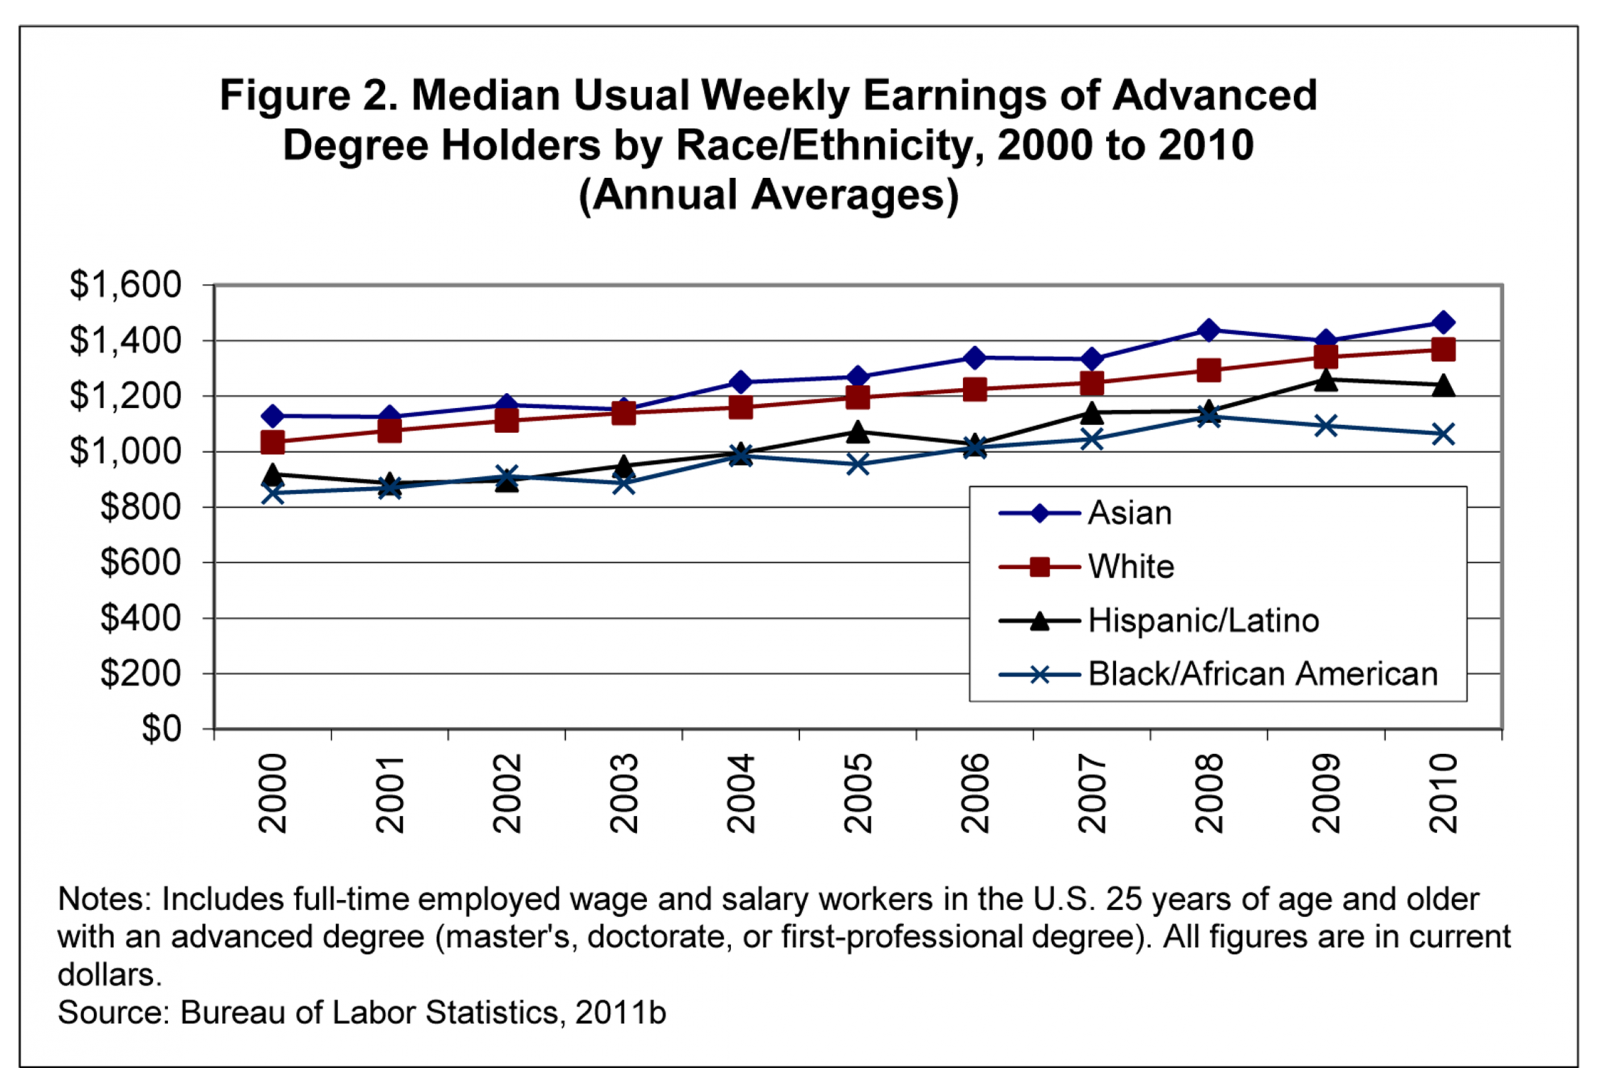
While the wage differences by gender have remained relatively constant over the past decade, wage differences by race/ethnicity have shifted (see Figure 2). In 2000, the median usual weekly earnings of Asians with advanced degrees were 23% higher than the median usual weekly earnings of Hispanics/Latinos ($1,129 versus $919) (Bureau of Labor Statistics, 2011b). But by 2010, the wage premium for Asians decreased to 18% ($1,466 for Asians versus $1,241 for Hispanics/Latinos), indicating that wages increased faster for Hispanics/Latinos than for Asians over the decade thereby decreasing the gap. Similarly, the median usual weekly earnings for whites with advanced degrees were 13% higher in 2000 than the median usual weekly earnings for Hispanics/Latinos ($1,034 versus $919), and the wage premium for whites decreased to 10% in 2010 ($1,368 for whites versus $1,241 for Hispanics/Latinos).
Not all of the shifts by race/ethnicity were in positive directions; Blacks/African Americans with advanced degrees lost ground on earnings over the past decade compared with their Asian and white peers. In 2000, Asians with advanced degrees earned 33% more than their Black/African American peers ($1,129 versus $851); in 2010, Asians earned 38% more ($1,466 versus $1,065). Whites with advanced degrees earned 22% more than their Black/African American peers in 2000 ($1,034 versus $851); in 2010, they earned 29% more ($1,368 versus $1,065). While median earnings for Blacks/African Americans with advanced degrees increased overall between 2000 and 2010 in current dollars, this gain was outpaced by the gains for Asians and whites. Furthermore, Blacks/African Americans experienced a decline in median earnings in 2009 and 2010 during the recession, thereby adding to the wages differences between Blacks/African Americans and Asians and whites.
The data from the CPS clearly show that higher education is a gateway to careers with higher-earnings potential, but they also reveal that disparities remain in earnings by gender and race/ethnicity. It is important, however, to note that the figures presented in this article do not control for field of study, occupation, length of professional employment, and other variables that might explain some (but not all) of the differences in earnings by gender and race/ethnicity.
Two factors in particular contribute to lower median earnings for women than for men. First, women with advanced degrees are more likely than men to be employed in some occupations in which salaries are lower, such as teaching, and less likely to be employed in some occupations with higher median salaries, such as engineering (Bureau of Labor Statistics, 2010). Second, women comprise a larger share of new employees with advanced degrees today than they did even a decade ago. In 1999-00, women earned 58% of all master’s degrees and 44% of all doctorates; by 2008-09 (the latest year for which data are available) they earned 60% of all master’s degrees and 50% of all doctorates (Council of Graduate Schools, 2010). This means that women are more concentrated than men in the portion of the advanced degree workforce that is younger and has fewer years of professional experience. This portion of the workforce tends to have lower earnings than older, more experienced workers.
Similarly, underrepresented minorities (Native Americans, Blacks/African Americans, and Hispanics/Latinos) are also more concentrated in the younger and less experienced portion of the advanced degree workforce. In 1999-00, underrepresented minorities earned 14% of all master’s degrees awarded to U.S. citizens and permanent residents and 11% of all research doctorates, compared with 18% of the master’s degrees and 13% of all research doctorates in 2008-09 (National Science Foundation, 2010 and 2011).
While differences in earnings by gender and race/ethnicity are evident in the CPS data, what is also evident is that regardless of gender or race/ethnicity, individuals with advanced degrees earn a higher median salary than their counterparts with lower levels of educational attainment. Advanced degrees do not guarantee higher wages, but they are often the pathway to occupations with greater economic rewards.
By Nathan E. Bell, Director, Research and Policy Analysis
References
Bureau of Labor Statistics. (2010). “Median Weekly Earnings of Full-time Wage and Salary Workers by Detailed Occupation and Sex.” Retrieved from http://bls.gov/cps/cpsaat39.pdf
Bureau of Labor Statistics. (2011a). “Table 9. Quartile and Selected Deciles of Usual Weekly Earnings of Full-time Wage and Salary Workers by Selected Characteristics, 2010 Annual Averages.” Retrieved from http://www.bls.gov/news.release/pdf/wkyeng.pdf
Bureau of Labor Statistics. (2011b). “Weekly and Hourly Earnings Data from the Current Population Survey.” Retrieved from http://data.bls.gov/onescreen/?survey=le
Council of Graduate Schools. (2010). CGS/GRE Survey of Graduate Enrollment and Degrees. Dataset.
National Science Foundation. (2010). Doctorate Recipients from U.S. Universities: 2009. Retrieved from http://www.nsf.gov/statistics/nsf11306
National Science Foundation. (2011). WebCASPAR Integrated Science and Engineering Resources Data System. Dataset. Accessed February 9, 2011.
![]()