

Thank you for visiting CGS! You are currently using CGS' legacy site, which is no longer supported. For up-to-date information, including publications purchasing and meeting information, please visit cgsnet.org.
Benchmarking

CGS is the leading source of information, data analysis, and trends in graduate education. Our benchmarking data help member institutions to assess performance in key areas, make informed decisions, and develop plans that are suited to their goals.
(Reprinted from the June 2011 issue of the CGS Communicator)
The 2011 CGS International Graduate Admissions Survey, Phase I: Applications included a series of special questions about application and financial support deadlines for graduate students. The questions were designed to gather information about how deadlines were set and whether there have been any changes to deadlines in recent years. This article presents a brief analysis of the responses to those questions.
Survey Methodology and Response Rate
In January 2011, a link to the 2011 Phase I survey was e-mailed to the graduate dean (or equivalent) at all 494 U.S. colleges and universities that were members of CGS. A total of 232 institutions responded to one or more of the special questions on application deadlines, for a response rate of about 47%. The analyses presented below are limited to these 232 respondents. They included 164 doctoral institutions, 57 master’s-focused institutions, and 11 institutions classified as baccalaureate or specialized in the 2010 basic Carnegie Classifications. Sixty-seven private, not-for-profit institutions responded to one or more of the application deadline questions, along with 165 public institutions. By geographic region, 60 of the responding institutions are in the Midwest, 46 are in the Northeast, 38 are in the West, and 88 are in the South.
Application Deadlines
Institutions were first asked, “Which one of the following best describes your institution’s application deadline(s) for fall admission at the graduate level?” Choosing from among three possible response options, the majority (53%) of the respondents indicated that application deadlines are set by individual programs. Nearly one-third (31%) said that the deadlines are set by individual programs, with a final deadline set by the institution or graduate school. The remaining 17% reported that there is an institution-wide deadline set by the institution or graduate school.
There were no statistically significant differences in responses by Carnegie classification or geographic region, but private, not-for-profit institutions were more likely than public institutions to report that application deadlines are set by individual programs (58% vs. 50%) and that there is an institution-wide deadline set by the institution or graduate school (24% vs. 14%). Private, not-for-profit institutions were less likely than their public counterparts to report that that deadlines are set by individual programs, with a final deadline set by the institution or graduate school (18% vs. 36%).
Changes to Application and Financial Support Deadlines
The next two questions related to changes in application deadlines for fall admission and/or financial support for graduate students, asking whether any deadlines have changed within the last three years. Since these two questions also addressed financial support—unlike the previous question which just focused on application deadlines—the findings are somewhat different. The first of these two questions collected data for respondents from institutions where deadlines for fall admission and/or financial support are set by the institution or graduate school, and read as follows: “If deadlines for fall admission and/or financial support are set by the institution or graduate school, have any of those deadlines changed within the last three years?” The second question collected data for respondents from institutions where deadlines for fall admission and/or financial support are set by individual programs, and read as follows: “If deadlines for fall admission and/or financial support are set by individual programs, are you aware of programs within your institution that have changed any deadlines for admission and/or financial support within the last three years?” Ninety-three institutions responded to both of these two questions, presumably because some application and/or financial support deadlines are set by the institution or graduate school and other application and/or financial support deadlines are set by individual programs.
Among the 143 institutions responding to the first of these two questions, thereby indicating that at least some deadlines for fall admission and/or financial support are set by the institution or graduate school, 62% reported that those deadlines have not changed within the last three years. Three out of ten respondents (30%) reported that the deadlines are now earlier, while 8% said that the deadlines are now later. (Eighty-six respondents selecting ‘not applicable’ and three institutions not responding to this question were excluded from these calculations.) There were no statistically significant differences in responses to this question by Carnegie classification, geographic region, or institutional control.
The respondents to this question were then asked to indicate which types of deadlines changed within the last three years. Among the 43 respondents indicating that deadlines are now earlier, 67% reported that the deadline for international admissions changed, 51% said that the deadline for domestic admissions changed, and 49% said that the deadline for students seeking financial support changed. Among the 11 respondents indicating that deadlines are now later, eight respondents reported that the deadline for international admissions changed, five respondents said that the deadline for domestic admissions changed, and only one said that the deadline for students seeking financial support changed.
Among the 164 institutions responding to the second of these two questions, thereby indicating that at least some deadlines for fall admission and/or financial support are set by individual programs, 37% reported that the deadlines are now earlier, 31% said that some deadlines are now earlier and some are now later, 29% said that the deadlines have not changed within the last three years, and 3% said that the deadlines are now later. (Sixty respondents selecting ‘not applicable/not aware of any changes’ and eight institutions not responding to this question were excluded from these calculations.) Doctoral institutions were more likely than master’s-focused institutions to indicate that deadlines have changed, with more than four out of ten indicating that some deadlines are now earlier and some are now later, as shown in Table 1. There were no statistically significant differences in responses to this question by geographic region or institutional control.

As with the previous question, respondents were then asked to indicate which types of deadlines changed within the last three years. Among the 60 respondents indicating that deadlines are now earlier, 70% reported that the deadline(s) for international admissions changed, 75% said that the deadline(s) for domestic admissions changed, and 40% said that the deadline(s) for students seeking financial support changed. Among the five respondents indicating that deadlines are now later, three respondents reported that the deadline(s) for international admissions changed, four respondents said that the deadline(s) for domestic admissions changed, and only one said that the deadline(s) for students seeking financial support changed. A total of 51 respondents indicated that some deadlines are now earlier and some are now later, and among these respondents the vast majority reported that the deadlines for international admissions (84%) and domestic admissions (88%) changed. More than half (53%) indicated that the deadline(s) for students seeking financial support changed.
Conclusions
Responding institutions were more likely to indicate that application deadlines for fall admission are set by individual programs, rather than by the institution or graduate school. Institutions where deadlines for fall admission and/or financial support are set by individual programs were nearly twice as likely to report that deadlines have changed within the last three years as institutions where deadlines are set by the institution or graduate school—seven out of ten of the former reported changes to deadlines compared with four out of ten of the latter. The majority of institutions changing deadlines made those deadlines earlier, rather than later. For example, among institutions where deadlines are set by the institution or graduate school, respondents indicating earlier deadlines outnumbered respondents indicating later deadlines by a factor of four to one.
The data presented here are admittedly from a relatively small sample of the institutions that award graduate degrees in the United States. And since the data were collected through a survey that primarily gathers data on international students, the responses may not be representative of all institutions, particularly those with smaller numbers of international students. That being said, the data suggest that there may be a trend toward earlier deadlines for applications and financial support at U.S. graduate schools, and furthermore, that this change affects both international and domestic students. More information is needed, however, to interpret the true meaning of this finding. For example, the survey did not collect data on the actual deadline dates, so it is unclear how much deadlines have shifted (e.g., by one week, two weeks, etc.). The reasons for changes to deadlines are also not fully known. Changes to deadlines may have been made to align an institution with the deadlines of other institutions, to differentiate an institution from others, to align various deadlines within an institution, or for any other number of reasons. While the survey data do not illuminate the reasons for changes to deadlines, they clearly show that some institutions and graduate programs are making changes to deadlines for fall admission and financial support.
By Nathan E. Bell, Director, Research and Policy Analysis
(Reprinted from the July 2011 issue of the CGS Communicator)
According to data from the American Community Survey, about 6% of the U.S. population ages 5 to 20 and 13% of the U.S. population ages 21 to 64 had a disability in 2007 (U.S. Census Bureau, 2011a and 2011b). Data on the participation of individuals with disabilities in graduate education is not as widely disseminated as data on graduate enrollment by other student characteristics, such as gender, citizenship, and race/ethnicity, but some data do exist to shed light on this topic.
One somewhat unlikely source of information on graduate students with disabilities is the National Postsecondary Student Aid Study (NPSAS). The main purpose of the NPSAS is to examine how students finance their education, but the survey data can also provide estimates of graduate enrollment by student characteristics, including disability status. The NPSAS defines a disability as a condition such as blindness; deafness; severe vision or hearing impairment; substantial limitation of one or more basic physical activities such walking, climbing stairs, reaching, lifting, or carrying; or any other physical, mental, emotional, or learning condition that lasts six months or more.
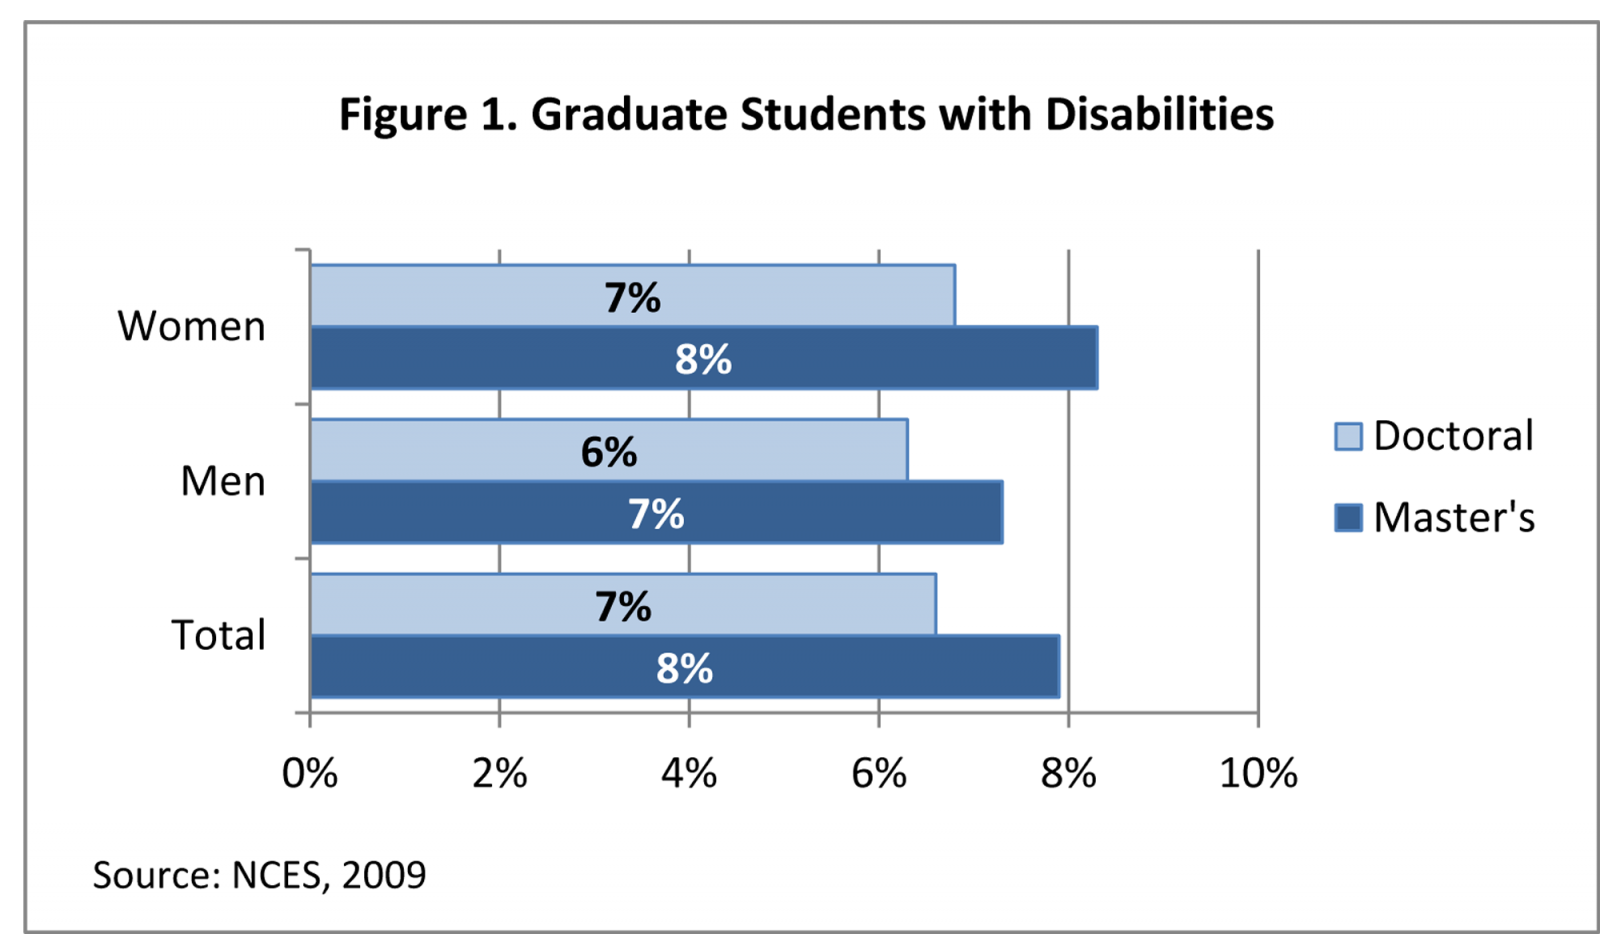
According to data from the most recent NPSAS, about 8% of master’s students and 7% of doctoral students in academic year 2007-08 had some type of disability (NCES, 2009). At both the master’s and doctoral levels in 2007-08, women were slightly more likely than men to report having a disability—8% vs. 7% at the master’s level and 7% vs. 6% at the doctoral level, as shown in Figure 1.
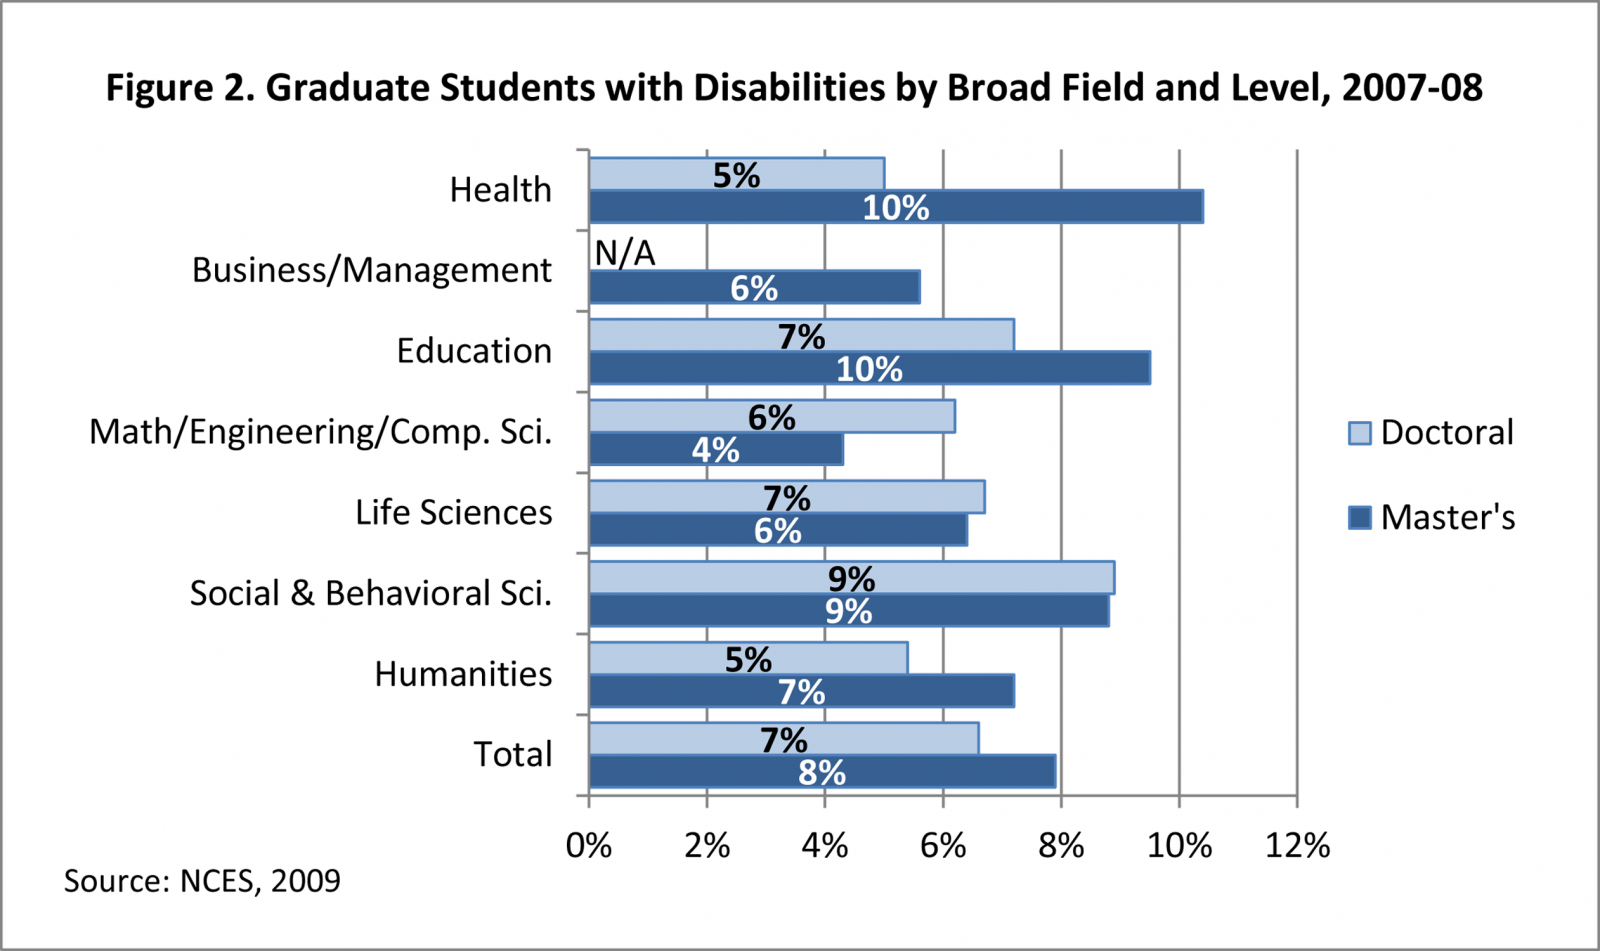
The NPSAS data also show that the percentage of graduate students who reported having some type of disability in academic year 2007-08 varied by broad field. At the master’s level, students enrolled in mathematics, engineering, and computer science were least likely to report having a disability (4%), while master’s students in the broad fields of health and education were most likely to report having a disability (both 10%), as shown in Figure 2. At the doctoral level, 5% of students in the broad fields of health and humanities reported having some type of disability, compared with 9% of doctoral students in social and behavioral sciences. Data for business/management at the doctoral level were suppressed due to the small sample size.
In addition to showing the percentage of students with a disability by broad field, the NPSAS data also illustrate the distribution of students with and without disabilities across broad fields. In most cases, the distributions were very similar in 2007-08, with students with and without disabilities being distributed in similar shares across most broad fields of study. For example, at the master’s level, 8% of all students with disabilities and 7% of all students without disabilities were enrolled in social and behavioral sciences. Similarly, 14% of all doctoral students with disabilities, as well as 14% of all doctoral students without disabilities, were enrolled in life sciences. But, there were some cases in which the distributions varied. At the master’s level, students with disabilities were more likely to be in education than their counterparts without disabilities; 35% of all master’s students with disabilities were enrolled in education in 2007-08 compared with 29% of all master’s students without disabilities. In contrast, master’s students with disabilities were less likely to be in business/management than students without disabilities (18% vs. 25%). At the doctoral level, students with disabilities were more likely to be enrolled in social and behavioral sciences then students without disabilities (19% vs. 13%).
A second source of data on graduate students with disabilities is the annual Survey of Earned Doctorates (SED), which is administered to recipients of research doctorates in the United States. In its definition of disability, the SED includes blindness/visual impairment, physical/orthopedic disability, deafness/hard of hearing, learning/cognitive disability, vocal/speech disability, and other/unspecified disabilities. According to the SED, 1.5% of all doctorate recipients in 2009 reported having one or more disabilities of any type (National Science Foundation, 2010). This percentage is considerably lower than the NPSAS estimate of the percentage of doctoral enrollees with disabilities, but it is important to note that the populations and methodologies of the two surveys are very different, which might explain the difference between the two figures. First, the SED only collects data on recipients of research doctorates, while the NPSAS includes in its estimate students enrolled in all doctoral programs, including practice-oriented programs such as the Psy.D., DPT and Ed.D. In addition, the response rate for the SED is typically in the 90-95% range each year, while the NPSAS is a sample survey based on a much smaller subset of doctoral students and therefore is subject to sampling errors. Finally, the SED reports data on doctorate recipients while the NPSAS surveys doctoral enrollees. While it is possible that there are differences in completion rates between students with and without disabilities which could result in students with disabilities comprising a higher share of enrollees than degree recipients, the available datasets are unable to indicate whether this is the case.
The SED provides disaggregated data by field of study and student demographics. By broad field of study, the percentage of doctorate recipients with one or more disabilities of any type ranged from a low of 0.7% in engineering to a high of 2.6% in education. By gender, 1.3% of male doctorate recipients and 1.6% of female doctorate recipients reported a disability. And by citizenship, U.S. citizen and permanent resident doctorate recipients were more likely than temporary visa holders to report having a disability – 2.1% vs. 0.4%.
The National Science Foundation also publishes the most accessible, albeit somewhat narrowly focused, source of data on individuals with disabilities, Women, Minorities, and Persons with Disabilities in Science and Engineering (National Science Foundation, 2011). This online data compendium is updated biennially and includes data tables on scientists and engineers with disabilities and graduate students in science and engineering with disabilities, relying on the SED and the NPSAS as data sources. While the data tables focus only on science and engineering, they provide more detailed data on disabilities than other reports based on the SED and do so in a more user-friendly format than the NPSAS.
Although the figures vary between the two sources, the SED and the NPSAS provide some information on the participation of students with disabilities in graduate education. Regardless of the data source, the scope of that participation highlights the importance of addressing the varied and unique barriers that students with disabilities face in their pathways to and through graduate school.
By Nathan E. Bell, Director, Research and Policy Analysis
References
National Center for Education Statistics (NCES). 2009. 2007-08 National Postsecondary Student Aid Study (NPSAS:08). Dataset.
National Science Foundation. 2010. Doctorate Recipients from U.S. Universities: 2009. Retrieved from www.nsf.gov/statistics/nsf11306/nsf11306.pdf
National Science Foundation. 2011. Women, Minorities, and Persons with Disabilities in Science and Engineering: 2011. Retrieved from www.nsf.gov/statistics/wmpd/
U.S. Census Bureau. 2011a. “R1801. Percent of People 5 to 20 Years Old With a Disability.” Retrieved from http://factfinder.census.gov
U.S. Census Bureau. 2011b. “R1802. Percent of People 21 to 64 Years Old With a Disability.” Retrieved from http://factfinder.census.gov
(Reprinted from the August/September 2011 issue of the CGS Communicator)
While the primary focus of the CGS International Graduate Admissions Survey is on the participation of international students in U.S. graduate education, this year’s Phase II survey also asked institutions to respond to two questions about prospective U.S. citizen and permanent resident graduate students. In the first question, institutions were asked to provide the number of applications for graduate programs received from U.S. citizens and permanent residents for fall 2010 and fall 2011. In the second question, institutions were asked to provide the number of offers of admission for graduate programs granted to U.S. citizens and permanent residents for fall 2010 and fall 2011, as of June 5th or the same data each year. This article presents an analysis of the findings from these two questions.
The survey population for the 2011 CGS International Graduate Admissions Survey, Phase II: Final Applications and Initial Offers of Admission consisted of all 493 U.S. colleges and universities that were members of CGS as of May 2011. A link to the survey instrument was e-mailed to the graduate dean (or equivalent) at each member institution on June 8, 2011 and responses were collected electronically through July 31, 2011.
Applications from U.S. Citizens and Permanent Residents
A total of 234 institutions provided data on applications from U.S. citizens and permanent residents for fall 2010 and fall 2011 (Council of Graduate Schools, 2011). Of those institutions, 170 (73%) were public institutions, 63 (27%) were private, not-for-profit institutions, and one was a private, for-profit institution. By Carnegie classification, 171 (73%) of the respondents were doctoral institutions, 50 (21%) were master’s-focused institutions, and 13 (6%) were institutions classified as baccalaureate or specialized. By geographic region, 65 (28%) of the responding institutions are located in the Midwest, 43 (18%) in the Northeast, 40 (17%) in the West, and 86 (37%) in the South. Respondents to the question included 71 of the 100 largest institutions in terms of the number of graduate degrees awarded to U.S. citizens and permanent residents (National Science Foundation, 2011). The 234 responding institutions conferred about 40% of all graduate degrees awarded to U.S. citizens and permanent residents in the United States in 2008-09.
Overall, applications from U.S. citizens and permanent residents fell 2% between fall 2010 and fall 2011 (see Table 1). Of the 234 institutions that provided data for both 2010 and 2011, 125 (53%) reported a decrease in applications from U.S. citizens and permanent residents for fall 2011, with an average decline of 8% at these institutions. At the 108 institutions (46%) reporting an increase, the average gain in applications from U.S. citizens and permanent residents was 6%. One institution reported no change in applications from U.S. citizens and permanent residents between 2010 and 2011.
The change in applications from U.S. citizens and permanent residents varied minimally by the number of graduate degrees awarded. At the 71 responding institutions that are among the 100 largest in terms of the total number of graduate degrees awarded to U.S. citizens and permanent residents, applications from U.S. citizens and permanent residents fell 3%, while at the 163 responding institutions outside the largest 100, applications from U.S. citizens and permanent residents fell 2%.
Applications from U.S. citizens and permanent residents fell 3% in fall 2011 at public institutions, slightly more than the 2% drop at private, not-for-profit institutions. Doctoral institutions reported a 2% decrease in applications from U.S. citizens and permanent residents, while master’s-focused institutions reported a 4% drop. Decreases in applications from U.S. citizens and permanent residents occurred in all four geographic regions of the United States, with the largest decreases in institutions located in the South and the West (both -3%), followed by the Midwest (-2%) and the Northeast (-1%).

Offers of Admission to U.S. Citizens and Permanent Residents
A total of 230 institutions provided data on offers of admission to U.S. citizens and permanent residents for fall 2010 and fall 2011 (Council of Graduate Schools, 2011). Of those institutions, 167 (73%) were public institutions, 62 (27%) were private, not-for-profit institutions, and one was a private, for-profit institution. By Carnegie classification, 169 (73%) of the respondents were doctoral institutions, 49 (21%) were master’s-focused institutions, and 12 (5%) were institutions classified as baccalaureate or specialized. By geographic region, 63 (27%) of the responding institutions are located in the Midwest, 42 (18%) in the Northeast, 39 (17%) in the West, and 86 (37%) in the South. Respondents to the question included 71 of the 100 largest institutions in terms of the number of graduate degrees awarded to U.S. citizens and permanent residents (National Science Foundation, 2011).
Overall, offers of admission to U.S. citizens and permanent residents fell 3% between fall 2010 and fall 2011 (see Table 1). Of the 230 institutions that provided data for both 2010 and 2011, 132 (57%) reported a decrease in offers of admission to U.S. citizens and permanent residents for fall 2011, with an average decline of 11% at these institutions. At the 98 institutions (43%) reporting an increase, the average gain in offers of admission to U.S. citizens and permanent residents was 9%.
The decrease in offers of admission was greater at institutions awarding smaller numbers of graduate degrees to U.S. citizens and permanent residents. At the 71 responding institutions that are among the 100 largest in terms of the total number of graduate degrees awarded to U.S. citizens and permanent residents, offers of admission to U.S. citizens and permanent residents fell 1%, while at the 159 responding institutions outside the largest 100, offers of admission to U.S. citizens and permanent residents fell 7%.
Offers of admission to U.S. citizens and permanent residents fell 4% in fall 2011 at public institutions, a larger decrease than the 1% drop at private, not-for-profit institutions. Doctoral institutions reported a 3% decrease in offers of admission to U.S. citizens and permanent residents, similar to the 4% drop at master’s-focused institutions. Offers of admission to U.S. citizens and permanent residents remained flat at institutions located in the West, and declined in the South (-6%), the Northeast (-3%), and the Midwest (-2%).
Discussion
The findings for U.S. citizens and permanent residents in the Phase II survey are in stark contrast to those for international students. The 2% decline in applications from U.S. citizens and permanent residents compares with an 11% increase in international applications for fall 2011 (Bell, 2011). Similarly, the 3% decline in offers of admission to U.S. citizens and permanent residents compares with an 11% increase in international offers of admission for fall 2011.
While there are different trends for domestic and international students, the data do not necessarily indicate that international students are being admitted in lieu of domestic students. Since the increase in international offers of admission (+11%) mirrors the increase in international applications (+11%), and the decrease in domestic offers of admission (-3%) mirrors the decrease in domestic applications (-2%), the changes in offers of admission may simply be a reflection of the changes that occurred in application volumes.
Two important caveats need to be considered in the interpretation of these data. First, the figures for U.S. citizens and permanent residents may not be as final as those for international students. Some colleges and universities continue to admit students throughout the summer, particularly for master’s-level programs. Given the time it takes to secure a visa, international students are less likely to apply at this late stage than are domestic students, so it is possible that the final figures for U.S. citizens and permanent residents might differ from those presented here. Second, it is possible that the data may not be representative of all institutions in the United States. While the survey respondents award about 40% of all graduate degrees to U.S. citizens and permanent residents, trends may differ at institutions that did not respond to the survey. This non-response bias is especially important to consider since the data on U.S. citizens and permanent residents were collected as part of the CGS International Graduate Admissions Survey. Institutions with small numbers of international students—particularly master’s-focused institutions—may have been less likely to respond to the survey.
The survey is not able to shed light on the exact cause of the declines in U.S. citizen and permanent resident applications and offers of admission, but several factors, including the continued uncertain national economy, declining state budgets and their effect on financial aid packages at public institutions, the weak job market, the availability of student loans, and many other factors, are likely at play. What the survey does reveal is the need to continue to track the application and enrollment patterns of domestic students and the importance of providing the pathways and support needed for these students to successfully enter graduate education.
By Nathan E. Bell, Director, Research and Policy Analysis
References:
Bell, N. 2011. Findings from the 2011 CGS International Graduate Admissions Survey, Phase II: Final Applications and Initial Offers of Admission. Washington, DC: Council of Graduate Schools.
Council of Graduate Schools. 2011. 2011 CGS International Graduate Admissions Survey, Phase II: Final Applications and Initial Offers of Admission. Dataset.
National Science Foundation. 2011. WebCASPAR Integrated Science and Engineering Resources Data System. Accessed August 11, 2011.
(Reprinted from the October 2011 issue of the CGS Communicator)
The results of the latest CGS/GRE Survey of Graduate Enrollment and Degrees, released in September, revealed that first-time graduate enrollment in the broad field of education fell sharply by 8.3% between fall 2009 and fall 2010 (Council of Graduate Schools, 2011). This decline was the largest of any broad field in 2010 and is particularly concerning since about 20% of all first-time graduate students are enrolled in education. This article provides a closer examination of the decline in first-time graduate enrollment that occurred in education in fall 2010, exploring variations by field of study, attendance status, race/ethnicity, degree level, and gender.
As shown in Table 1, first-time graduate enrollment fell in 2010 in most fields of study within the broad field of education. Declines between fall 2009 and fall 2010 were particularly steep in secondary education (-16%.1), elementary education (-14.9%), and education administration (-12.9%). The only two fields of study to experience gains in first-time graduate enrollment in fall 2010 were higher education (8.7%) and early childhood education (0.6%), but these are two of the smallest fields of study, accounting for just 4.3% of all first-time enrollees in education. Despite the one-year decline, first-time graduate enrollment increased 3.3% annually on average over the past decade, with growth in all fields of study except elementary education and early childhood education.

Much of the decline in first-time graduate enrollment in the broad field of education between 2009 and 2010 was driven by a steep drop in part-time enrollment. Overall, part-time enrollment among first-time graduate students fell 13.1% in education in fall 2010, compared with a 2.8% decline in full-time enrollment (see Table 2). By field of study, declines in part-time enrollment among first-time graduate students were particularly steep in student counseling and personnel services (-25.0%), elementary education (-22.1%), and secondary education (-21.7%). Declines in first-time graduate enrollment were greater for part-time enrollees than full-time enrollees across all fields of study within education. For example, part-time enrollment fell 15.3% among first-time enrollees in education administration, compared with a 7.6% decline in full-time enrollment. Only in higher education did both full-time and part-time first-time graduate enrollment increase, with gains of 8.7% and 8.6%, respectively.

Declines in first-time graduate enrollment in the broad field of education were particularly large for Blacks/African Americans and American Indians/Alaskan Natives between 2009 and 2010, with decreases of 17.7% and 16.8% respectively (see Table 3). These declines are concerning since 25.4% of Black/African American and 23.4% of American Indian/Alaskan Native first-time enrollees in fall 2010 were in the broad field of education. The declines are also troubling because Blacks/African Americans are more highly represented in education than in most other broad fields; they comprised 10.5% of all U.S. citizen and permanent resident first-time enrollees in education in fall 2010, a share that was second only to the share they enjoyed in public administration and services (15.8%).
In every single field of study within education in fall 2010, Blacks/African Americans or American Indians/Alaskan Natives experienced the largest decline. For example, the largest decline in education administration was a 30.0% decrease for Blacks/African Americans, and the largest drop in curriculum and instruction was a 27.0% decrease for American Indians/Alaskan Natives. While relatively large decreases sometimes reflect the normal enrollment fluctuations that occur with small populations of students, the overall declines for these populations of students compared with their Hispanic/Latino and Asian/Pacific Islander counterparts are concerning. Also troubling is the 7.0% decline for White students, since they comprised two-thirds (65.8%) of all U.S. citizen and permanent resident first-time enrollees in education in fall 2010.

The majority (90.9%) of all first-time graduate students in the broad field of education are enrolled at the master’s degree or graduate certificate level. This level also includes students enrolled in education specialist programs. Just 9.1% of all first-time graduate students in education are enrolled at the doctoral level. Between 2009 and 2010, first-time graduate enrollment decreased more at the doctoral level (-10.1%) than at the master’s/graduate certificate level (-8.1%), but no strong patterns were observed by field of study and degree level. For example, first-time graduate enrollment fell 15.2% at the master’s/graduate certificate level in education administration, but only dropped 2.4% at the doctoral level in this field of study. In contrast, first-time graduate enrollment fell 1.6% at the master’s/graduate certificate level in educational assessment, evaluation, and research, but dropped 17.9% at the doctoral level. And in curriculum and instruction, first-time graduate enrollment fell by a similar amount at both the master’s/graduate certificate and doctoral levels (3.9% and 4.0%, respectively).
Finally, first-time graduate enrollment fell slightly more for women than for men in the broad field of education between 2009 and 2010 (-8.6% and -6.9%, respectively). This is important to note since women comprised about three-quarters (74.7%) of all first-time enrollees in education in fall 2010. As with first-time graduate enrollment by degree level, no strong patterns were observed by field of study and gender, with decreases by field of study sometimes greater for men and sometimes greater for women.
This closer examination of the data reveals that the overall decline in first-time graduate enrollment in the broad field of education in fall 2010 was driven mainly by a combination of three factors: a sharp drop in part-time enrollment; decreases in secondary education, elementary education, and education administration; and declines for Blacks/African Americans, American Indians/Alaskan Natives, and Whites. The recession is likely at the root of this decline. Since most graduate students in education are self-funded or employer-funded, we can surmise that the decrease in first-time graduate enrollment in education in fall 2010 reflects the hesitancy of prospective students to take on debt or to leave jobs for graduate school and an uncertain future, the hesitancy of employers to pay for graduate school for employees, and austere local and state budgets that affected the job market and support for continuing education for teachers.
By Nathan E. Bell, Director, Research and Policy Analysis
References:
Council of Graduate Schools. 2011. CGS/GRE Survey of Graduate Enrollment and Degrees. Dataset.
(Reprinted from the December 2011 issue of the CGS Communicator)
While the focus of the CGS International Graduate Admissions Survey is on the participation of international students in U.S. graduate schools, the 2011 Phase III survey also included a question that asked respondents to provide preliminary data on the number of U.S. citizen and permanent resident first-time graduate students in fall 2010 and fall 2011. An analysis of the findings from that question is presented below.
Methodology and Response Rate
The survey population for the 2011 CGS International Graduate Admissions Survey, Phase III: Final Offers of Admission and Enrollment consisted of all 494 U.S. colleges and universities that were members of CGS as of September 2011. A link to the survey instrument was e-mailed to the graduate dean (or equivalent) at each member institution on September 13, 2011, and responses were collected electronically through October 24, 2011.
A total of 232 institutions provided first-time graduate enrollment data for U.S. citizens and permanent residents for both fall 2010 and fall 2011, for a response rate of 47% on this question. For some institutions, the Phase III survey was administered before final first-time enrollment numbers were known, therefore these institutions provided preliminary figures as of the same date each year.
Of the 232 respondents to this survey question, 170 (73%) were public institutions, 61 (26%) were private, not-for-profit institutions, and one was a private, for-profit institution. By basic Carnegie classification, 166 (72%) of the respondents were doctoral institutions, 48 (21%) were master’s-focused institutions, and 18 (8%) were classified as specialized or baccalaureate institutions. By geographic region, 60 (26%) of the responding institutions are located in the Midwest, 44 (19%) in the Northeast, 39 (17%) in the West, and 89 (38%) in the South. Respondents to the question included 67 of the 100 largest institutions in terms of the number of graduate degrees awarded to U.S. citizens and permanent residents (National Science Foundation, 2011). The 232 responding institutions conferred about 39% of all graduate degrees awarded to U.S. citizens and permanent residents in the United States in 2008-09. Given this diverse set of survey respondents, it is likely that the preliminary data from these institutions reflect the current trends in first-time enrollment of U.S. citizens and permanent residents in graduate schools across the United States.
Findings
Overall, the institutions responding to the survey reported a 1% drop in first-time graduate enrollment of U.S. citizens and permanent residents between fall 2010 and fall 2011 (see Table 1). A slight majority of the respondents (128, or 55%) reported a decrease in first-time enrollment of U.S. citizens and permanent residents in 2011, with an average decline of 6% at these institutions. At the 102 institutions (44%) reporting an increase, the average gain was 8%. Two institutions (1%) reported no change in U.S. citizen and permanent resident first-time graduate enrollment between fall 2010 and fall 2011.
Public institutions and private, not-for-profit institutions both experienced a 1% decrease in U.S. citizen and permanent resident first-time graduate enrollment between fall 2010 and fall 2011. By basic Carnegie classification, the number of U.S. citizen and permanent resident first-time enrollees dropped 1% at doctoral institutions and fell 2% at master’s-focused institutions.
U.S. citizen and permanent resident first-time graduate enrollment dropped in three of the four major regions of the United States in 2011. In the West and Northeast, the numbers of U.S. citizens and permanent residents enrolling in graduate school for the first time dropped by 2%, and in the Midwest the decrease was 1%, but U.S. citizen and permanent resident first-time graduate enrollment increased 1% in the South in 2011.

Smaller institutions in terms of the number of graduate degrees awarded to U.S. citizens and permanent residents were more likely to see a decrease in first-time graduate enrollment than larger institutions. In fall 2011, U.S. citizen and permanent resident first-time graduate enrollment fell 2% on average at the responding institutions that are not among the 100 largest in terms of the number of graduate degrees awarded to U.S. citizens and permanent residents, but remained flat on average at the responding institutions that are among the 100 largest.
Discussion
The preliminary data from the Phase III survey suggest that U.S. citizen and permanent resident first-time graduate enrollment fell in 2011 for the second year in a row. The 1% decrease from this year’s Phase III survey follows a 1.2% drop in fall 2010 that was documented in the most recent CGS/GRE Survey of Graduate Enrollment and Degrees (Bell, 2011b).
The 1% decrease in U.S. citizen and permanent resident first-time graduate enrollment in fall 2011 contrasts sharply with an 8% increase in international first-time graduate enrollment this fall (Bell, 2010a). Furthermore, this is the second year in a row in which domestic first-time graduate enrollment decreased while international first-time graduate enrollment increased. In fall 2010, international first-time graduate enrollment increased 4.7%, compared with the 1.2% drop for domestic students (Bell, 2011b).
While international first-time graduate enrollment appears to have outpaced domestic first-time graduate enrollment this year and last, this is in contrast to the trend that has been seen over the past decade. Between fall 2000 and fall 2010, first-time graduate enrollment of U.S. citizens and permanent residents increased by 4.4% annually on average, compared with a 2.3% average annual gain for international students (Bell, 2010b).
The erosion in first-time graduate enrollment that occurred in fall 2010 was caused in large part by declines in education, business, and public administration, particularly in part-time enrollment in these fields (Bell, 2010b). Since most graduate students in these fields are self-funded or employer-funded, it is likely that the current economic situation and anemic recovery of the job market are at the root of the decline. It is possible that prospective students in these broad fields remain hesitant to take on debt or to leave jobs for graduate school, that some employers have reduced or eliminated educational benefits for their employees, and that cuts in the primary and secondary teaching workforce in some states have left some teachers unemployed and hesitant to pursue more schooling, but the preliminary data on U.S. citizens and permanent residents from the 2011 Phase III survey do not provide the level of detail needed to determine the cause of this year’s decline. The more robust 2011 CGS/GRE Survey of Graduate Enrollment and Degrees, to be released next fall, will document the final change in first-time graduate enrollment for fall 2011.
By Nathan E. Bell, Director, Research and Policy Analysis
(Reprinted from the November 2011 issue of the CGS Communicator)
The United States continues to experience a high level of educational attainment, but many countries have surpassed, or will soon surpass, the U.S., according to the OECD’s latest annual compendium of international education statistics, Education at a Glance (OECD, 2011). The 495-page report assembles a wealth of data on a range of education indicators, including educational attainment, educational expenditures, and participation in education. This article uses data from Education at a Glance to examine educational attainment across OECD and G-20 countries.
The OECD report uses the International Standard Classification of Education (ISCED) framework, which takes into account differences in the structure of tertiary education (i.e., higher education) across countries, to make international comparisons of educational outcomes. The ISCED framework includes three categories that capture the equivalent of all U.S. associate’s degrees, bachelor’s degrees, master’s degrees, doctorates, and first-professional degrees. ISCED 5A (tertiary-type A) education programs are theory-based programs that prepare students for advanced research studies or for entry into professions with high skills requirements. This category includes U.S. bachelor’s and master’s degrees, as well as U.S. first-professional degrees in fields such as medicine, dentistry, and law. ISCED 5B (tertiary-type B) education programs are generally shorter in duration than ISCED 5A programs and provide students with practical, technical, or occupational skills. This category includes U.S. associate’s degrees. The final higher education category, ISCED 6 (advanced research programs), includes degree programs that result in the awarding of an advanced research qualification such as the Ph.D. (OECD, 1999; OECD 2011).
Across all OECD countries in 2009, 30% of all 25-64 year-olds had earned a tertiary-type B credential or higher, equivalent to a U.S. associate’s degree or higher. The 2009 figure reflects a nine percentage point gain from 21% in 1998. Twenty-one percent of all 25-64 year-olds in OECD countries in 2009 had earned a tertiary-type A credential or higher, equivalent to a U.S. bachelor’s degree or higher. Educational attainment rates for advanced research programs alone, equivalent to a U.S. Ph.D., are not included in the report.
The United States and Japan together accounted for 47% of all 25-64 year-olds with tertiary education (tertiary-type B or higher) in OECD countries in 2009, meaning that nearly one-half of the total population of individuals with tertiary education in OECD countries lived in the United States or Japan. If G-20 countries are also included in this calculation, the United States continues to be top-ranked, with 26% of the total population of 25-64 year-olds with tertiary education in OECD and G-20 countries in 2009, followed by China (12%), Japan (11%), the United Kingdom (5%), and Germany (5%).
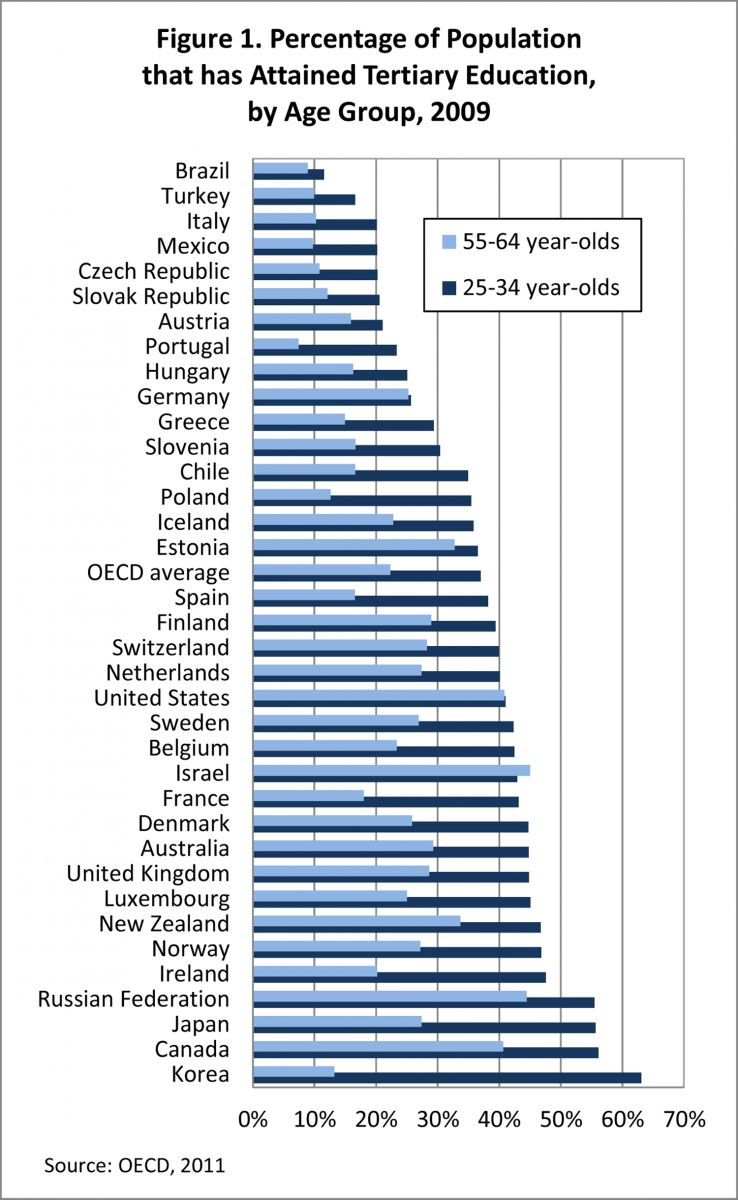
Figure 1 presents tertiary educational attainment rates by country for two age groups: 25-34 year-olds and 55-64 year-olds. In 2009, the United States ranked third among OECD countries in the percentage of 55-64 year-olds who had attained tertiary education. In the U.S., 41% of individuals in this age group had attained tertiary education in 2009, trailing only behind the Russian Federation (44%) and Israel (45%), and considerably higher than the OECD average of 22%. Among 25-34 year-olds, however, the United States ranked 16th in the percentage who had attained tertiary education, indicating that educational attainment is increasing faster in other OECD countries than in the United States. In the U.S., 41% of 25-34 year-olds had attained tertiary education in 2009, higher than the 37% OECD average, but considerably lower than top-ranked South Korea (63%). Canada (56%), Japan (56%), and the Russian Federation (55%) also had educational attainment rates for 25-34 year-olds that were considerably higher than the rate in the U.S.
Due to their stronger gains in educational attainment among younger individuals, more countries are expected to surpass the U.S. or increase their advantage in overall tertiary attainment (25-64 year-olds) over time, according to Education at a Glance. Countries such as Korea, Japan, Norway, Ireland, and Sweden, among others, already have high levels of tertiary attainment, but are expected to see that advantage increase in the coming years. In contrast, the United States, Israel, the Russian Federation, and Finland, among others, will see other countries approaching or surpassing their levels of educational attainment. Poland, Chile, and Portugal are expected to move closer to the OECD average in the coming years, while a handful of countries, including Austria, Brazil, and Germany, are expected to fall further behind in tertiary attainment.
The United States ranks higher in educational attainment when tertiary-type B programs are excluded. Among all OECD countries in 2009, 31% of all 25-64 year-olds in the United States had earned a tertiary-type A credential or higher, equivalent to a U.S. bachelor’s degree or higher. This figure was second only to Norway, where 34% had achieved this level of educational attainment. Once again, however, the U.S. ranked lower for 25-34 year-olds (11th) than 55-64 year-olds (1st), indicating that other countries will soon surpass the U.S. in the attainment of tertiary-type A credentials or higher.
Over the past decade (1999 to 2009), the average annual growth rate in tertiary attainment (tertiary-type B or higher) in the United States was 1.4%. This compares with an OECD average of 3.7%, and rates as high as 6.6% for Luxembourg, 6.5% for Poland, and 5.8% for Ireland. The 1.4% average annual rate of increase for the United States was the lowest of all OECD countries.
While the United States has long been a leader in educational attainment, the OECD data clearly show that the United States’ ranking has slipped over time and that it may soon be surpassed by even more countries in the near future. In order for the United States to remain competitive in the 21st century global marketplace, it must increase educational attainment for its citizenry, particularly graduate degree recipients with “the advanced knowledge and skills that will secure our future intellectual leadership in the knowledge economy (Wendler et al., 2010, pp. 1).”
By Nathan E. Bell, Director, Research and Policy Analysis
References:
OECD. 1999. Classifying Educational Programmes: Manual for ISCED-97 Implementation in OECD Countries. Retrieved from http://www.oecd.org/dataoecd/7/2/1962350.pdf
OECD. 2011. Education at a Glance 2011: OECD Indicators. Retrieved from http://www.oecd.org/dataoecd/61/2/48631582.pdf
Wendler, C., Bridgeman, B., Cline, F., Millett, C., Rock, J., Bell, N., and McAllister, P. 2010. The Path Forward: The Future of Graduate Education in the United States, Executive Summary. Princeton, NJ: Educational Testing Service.
The following external links provide access to additional benchmarking resources:
Bureau of Labor Statistics
Canadian Association for Graduate Studies
Carnegie Foundation
The College Board
Institute of International Education
National Center for Education Statistics
National Research Council
National Science Foundation
Organisation for Economic Co-operation and Development (OECD)
U.S. Census Bureau
Data Sources: The Rise of “Older” Graduate Students
December 2007
This article examines the participation of individuals 40 years old and older in graduate education.
Data Sources: International Dual, Joint, and Other Collaborative Degree Programs
October 2007
This article looks at the expanded efforts by American graduate programs to partner on various collaborative degree programs with higher education institutions from around the globe.
August/September 2007
This article examines trends in doctoral degree attainment among minorities, and how increasing the number of racial/ethnic minorities with advanced training at the graduate level, particularly at the doctoral level, is a crucial element for meeting future workforce needs.
Data Sources: Graduate Education and Regional Economic Growth
July 2007
This article analyzes empirical findings that knowledge capital and entrepreneurship capital have both been observed as factors as equal to physical capital and labor to drive economic growth.
Data Sources: Results for the CGS Pressing Issues Survey
June 2007
Each year, CGS asks graduate deans at member institutions to identify the three most important or “pressing” issues or challenges they currently face. This article summarizes the results of the 2007 CGS Pressing Issues Survey..
Data Sources: Trends in International Graduate Student Enrollments, 2001 to 2006
May 2007
This article examines data from a CGS survey on international applications for admission to graduate schools that showed the number of non-citizens seeking to attend American graduate programs still had not recovered from the losses that occurred after 2001, along with the implications of these findings with regard to the future of the U.S. workforce.
Data Sources: Master’s Degree Persistence and Attainment- 1993 to 2003
April 2007
This article looks at NCES data that gave a valuable first-hand look at master’s degree attainment and time- to-degree rates for master’s candidates by race/ethnicity, gender, and other important demographic parameters since 1993.
Data Sources: Trends in New Ph.D.s Entering Academe, 1970 to 2005
March 2007
This article discusses the idea that recent trends suggest that the share of new research doctoral recipients taking faculty jobs fell sharply over the past 30 years, and this decline may have adversely affected students’ educational experiences.
January/February 2007
This article examines trends in the characteristics of doctoral students over the past decade as information has become more readily available.
CGS members have access to a special online report, Graduate Enrollment and Degrees by Fine Field: 2002 to 2012.
This report includes data tables on first-time and total graduate enrollment data by field of study (chemistry, history, philosophy, etc.), gender, citizenship, and race/ethnicity, and also includes, for the first time, data on graduate degrees awarded by field of study, degree level (master's vs. doctoral), and gender.
Data for 2012 are presented, along with one-, five-, and ten-year trends.
You must be logged in to access the report online.
For more information, please contact:
Data Sources: Small Increase in Domestic First-Time Graduate Enrollment in Fall 2010
December 2010
This article examines first-time graduate enrollment of U.S. citizens and permanent residents in fall 2010.
Data Sources: Changes in the Enrollment Status of Graduate Students
November 2010
This article examines changes in full- and part-time enrollment patterns at the national level over time.
Data Sources: The Effect of Changes to IPEDS Categories on Graduate Education Data
October 2010
Several recent changes to the U.S. Department of Education’s Integrated Postsecondary Education Data System (IPEDS) will have significant impacts on the data available to the graduate education community in the United States. This article explains how these changes affect the definitions of postbaccalaureate degree categories and race/ethnicity categories.
Data Sources: A Look at Loans and Cumulative Debt by Institutional Characteristics
August/September 2010
This article examines the use of student loans and cumulative loan debt among graduate students by institution type and Carnegie classification using data from the National Postsecondary Student Aid Study (NPSAS), a sample survey conducted by the National Center for Education Statistics.
Data Sources: Employment Trends among New Doctorate Recipients
July 2010
This article uses historical data from the Survey of Earned Doctorates (SED) to provide some insight about how new doctorate recipients may have fared in the recession in 2010.
Data Sources: Results from the 2010 CGS Pressing Issues Survey
May 2010
Each year, CGS asks graduate deans at member institutions to identify the three most important or “pressing” issues or challenges they currently face. This article summarizes the results from the 2010 CGS Pressing Issues Survey.
Data Sources: Graduate School Aspirations of American Freshmen
April 2010
Using data from The American College Freshman series, this article examines the higher education plans of college freshman.
Data Sources: Time-to-Degree for Doctorate Recipients
March 2010
Using data from the annual Survey of Earned Doctorates (SED), this article examines time-to-degree by broad field and demographics, and presents data on the overall improvement in time-to-degree over the past two decades.
Data Sources: State-Level Graduate Enrollment Degree Trends
January/February 2010
Using data from the CGS/GRE Survey of Graduate Enrollment and Degrees, this article examines changes over the past decade in graduate enrollment and degrees at the state level, and compares these trends to population growth and state appropriations for higher education.
![]()