

Thank you for visiting CGS! You are currently using CGS' legacy site, which is no longer supported. For up-to-date information, including publications purchasing and meeting information, please visit cgsnet.org.
Benchmarking

CGS is the leading source of information, data analysis, and trends in graduate education. Our benchmarking data help member institutions to assess performance in key areas, make informed decisions, and develop plans that are suited to their goals.
Washington, DC — New data from the Council of Graduate Schools (CGS) on graduate enrollments and degrees demonstrate the continued demand for graduate education in the U.S. According to a CGS report released today, both graduate applications (7.3%) and first-time graduate enrollment (1.8%) increased overall for the Fall 2020 semester, welcome news during the disruptive COVID-19 pandemic. While international graduate first-time enrollment declined 37.4%, domestic enrollment grew 12.9% — growth driven, in part, by increases in traditionally underrepresented students. First-time, part-time graduate enrollment increased by 13.5%. These data are part of the latest CGS/GRE Graduate Enrollment & Degrees: 2010-2020 report.
“Graduate schools had to pivot quickly as the pandemic disrupted traditional modes of instruction, increasing part-time, virtual, and hybrid learning options,” said CGS President Suzanne Ortega. “To see continued growth in first-time enrollment rates during a global pandemic shows confidence in the value of graduate education and the importance of increased flexibility in delivery methods.”
Ortega added that an increase in flexible learning options has supported diversity. “It’s striking that 43.4% of graduate students are enrolled part-time and these students are more likely to be women and students from traditionally underrepresented groups. We’ve long believed that improved access would further diversify the graduate student body, and these data provide supporting evidence.”
Between Fall 2019 and Fall 2020, first-time enrollment among underrepresented minorities grew at a healthy pace. First-time graduate enrollment of American Indian/Alaska Native students increased 8.8%, with corresponding increases of 16.0% for Black/African American students and 20.4% for Latinx students. While this growth is encouraging, Black/African American students constitute 12.8% of U.S. citizens and permanent resident graduate students overall, and remain considerably underrepresented in physical and earth sciences (3.8%), engineering (6.2%), and biological and agricultural sciences (6.6%). Similarly, Latinx students constitute 12.0% of U.S. citizens and permanent resident graduate students, and remain considerably underrepresented in mathematics and computer sciences (9.9%) and physical and earth sciences (10.4%).
Institutions responding to the CGS/GRE Survey of Graduate Enrollment & Degrees for Fall 2020 enrolled more than 1.7 million graduate students. Nearly three quarters (72.9%) of total graduate enrollment was in master’s programs. Over one million of those graduate students, or 59.7%, were women. Education (63.8%), business (53.0%), and health sciences (43.0%) continue to be the three largest broad fields of study and the fields with the largest proportions of part-time graduate students.
About the report
Graduate Enrollment and Degrees: 2010 to 2020 presents the findings of an annual survey of U.S. graduate schools, co-sponsored by CGS and the Graduate Record Examinations (GRE) Board. It is the only annual national survey that collects data on graduate enrollment by all fields of study and is the only source of national data on graduate applications by broad field of study. The report includes responses from 558 institutions and presents statistics on graduate applications and enrollment for Fall 2020, degrees conferred in 2019-20, and trend data for one-, five- and ten-year periods.
###
The Council of Graduate Schools (CGS) is an organization of approximately 500 institutions of higher education in the United States and Canada engaged in graduate education, research, and the preparation of candidates for advanced degrees. The organization’s mission is to improve and advance graduate education, which it accomplishes through advocacy in the federal policy arena, research, and the development and dissemination of best practices.
Below are downloadable figures and tables from Graduate Enrollment and Degrees, 2010-2020. Each figure is available as a PDF. Each table is available as an Excel file and a PDF.
Figure 1. Graduate Application Acceptance Rates by Carnegie Classification and Degree Level, Fall 2020 (PDF)
Figure 2. First-time Graduate Enrollment by Broad Field of Study and Attendance Status, Fall 2020 (PDF)
Figure 3. First-time Graduate Enrollment by Broad Field of Study and Citizenship, Fall 2020 (PDF)
Figure 4. U.S. Citizen and Permanent Resident First-time Enrollment by Race/Ethnicity, Fall 2020 (PDF)
Figure 5. Total Graduate Enrollment by Broad Field of Study and Degree Level, Fall 2020 (PDF)
Figure 6. Changes in Graduate Applications by Degree Level, Fall 2010 to Fall 2020 (PDF)
Figure 7. Trends in First-time Graduate Enrollment by Field of Study, Fall 2010 to Fall 2020 (PDF)
Figure 8. Percentage Shares in Total Graduate Enrollment of U.S. Citizens and Permanent residents by Selected Race/Ethnicity, Fall 2010 to Fall 2020 (PDF)
Figure 9. Trends in Graduate Degrees Awarded by Level, Fall 2010 to Fall 2020 (PDF)
Table B.1 Applications for Admission to Graduate School by Institution Type, Carnegie Classification, and Degree Level, Fall 2020 (Excel, PDF)
Table B.2 Applications for Admission to Graduate School by Broad Field and Degree Level, Fall 2020 (Excel, PDF)
Table B.3 First-Time Graduate Enrollment by Institution Type, Carnegie Classification, Gender, and Attendance Status, Fall 2020 (Excel, PDF)
Table B.4 First-Time Graduate Enrollment by Broad Field, Gender, and Attendance Status, Fall 2020 (Excel, PDF)
Table B.5 First-Time Graduate Enrollment by Gender, Attendance Status, and Broad Field, Fall 2020 (Excel, PDF)
Table B.6 First-Time Graduate Enrollment by Broad Field and Degree Level, Fall 2020 (Excel, PDF)
Table B.7 First-Time Graduate Enrollment by Degree Level, Gender, and Broad Field, Fall 2020 (Excel, PDF)
Table B.8 First-Time Graduate Enrollment by Institution Type, Carnegie Classification, and Citizenship, Fall 2020 (Excel, PDF)
Table B.9 First-Time Graduate Enrollment by Broad Field and Citizenship, Fall 2020 (Excel, PDF)
Table B.10 First-Time Graduate Enrollment by Citizenship, Race/Ethnicity, and Gender, Fall 2020 (Excel, PDF)
Table B.11 First-Time Graduate Enrollment by Broad Field and Race/Ethnicity, Fall 2020 (U.S. Citizens and Permanent Residents Only) (Excel, PDF)
Table B.12 Total Graduate Enrollment by Institution Type, Carnegie Classification, Gender, and Attendance Status, Fall 2020 (Excel, PDF)
Table B.13 Total Graduate Enrollment by Broad Field, Gender, and Attendance Status, Fall 2020 (Excel, PDF)
Table B.14 Total Graduate Enrollment by Gender, Attendance Status, and Broad Field, Fall 2020 (Excel, PDF)
Table B.15 Total Graduate Enrollment by Broad Field and Degree Level, Fall 2020 (Excel, PDF)
Table B.16 Total Graduate Enrollment by Degree Level, Gender, and Broad Field, Fall 2020 (Excel, PDF)
Table B.17 Total Graduate Enrollment by Institution Type, Carnegie Classification, and Citizenship, Fall 2020 (Excel, PDF)
Table B.18 Total Graduate Enrollment by Broad Field and Citizenship, Fall 2020 (Excel, PDF)
Table B.19 Total Graduate Enrollment by Citizenship, Race/Ethnicity, and Gender, Fall 2020 (Excel, PDF)
Table B.20 Total Graduate Enrollment by Broad Field and Race/Ethnicity, Fall 2020 (U.S. Citizens and Permanent Residents Only) (Excel, PDF)
Table B.21 Graduate Degrees and Certificates Awarded by Degree Level, Carnegie Classification, and Institution Type, 2019-20 (Excel, PDF)
Table B.22 Graduate Degrees and Certificates Awarded by Degree Level and Broad Field, 2019-20 (Excel, PDF)
Table B.23 Graduate Certificates Awarded by Broad Field and Gender, 2019-20 (Excel, PDF)
Table B.24 Master’s Degrees Awarded by Broad Field and Gender, 2019-20 (Excel, PDF)
Table B.25 Doctoral Degrees Awarded by Broad Field and Gender, 2019-20 (Excel, PDF)
Table C.1 Applications for Admission to Graduate School by Institution Type, Carnegie Classification, and Degree Level, 2010 to 2020 (Excel, PDF)
Table C.2 Applications for Admission to Graduate School by Broad Field, 2010 to 2020 (Excel, PDF)
Table C.3 Applications for Admission to Graduate School by Broad Field and Degree Level, 2010 to 2020 (Excel, PDF)
Table C.4 First-Time Graduate Enrollment by Institution Type and Carnegie Classification, 2010 to 2020 (Excel, PDF)
Table C.5 First-Time Graduate Enrollment by Citizenship and Race/Ethnicity, 2010 to 2020 (Excel, PDF)
Table C.6 First-Time Graduate Enrollment by Citizenship, Race/Ethnicity, and Gender, 2010 to 2020 (Excel, PDF)
Table C.7 First-Time Graduate Enrollment by Broad Field, 2010 to 2020 (Excel, PDF)
Table C.8 First-Time Graduate Enrollment by Broad Field and Attendance Status, 2010 to 2020 (Excel, PDF)
Table C.9 First-Time Graduate Enrollment by Broad Field and Citizenship, 2010 to 2020 (Excel, PDF)
Table C.10 First-Time Graduate Enrollment by Broad Field and Race/Ethnicity, 2010 to 2020 (U.S. Citizens and Permanent Residents Only) (Excel, PDF)
Table C.11 First-Time Graduate Enrollment by Broad Field and Gender, 2010 to 2020 (Excel, PDF)
Table C.12 Doctorate-Level First-Time Enrollment by Broad Field and Gender, 2010 to 2020 (Excel, PDF)
Table C.13 Master’s-Level First-Time Enrollment by Broad Field and Gender, 2010 to 2020 (Excel, PDF)
Table C.14 Total Graduate Enrollment by Institution Type and Carnegie Classification, 2010 to 2020 (Excel, PDF)
Table C.15 Total Graduate Enrollment by Citizenship and Race/Ethnicity, 2010 to 2020 (Excel, PDF)
Table C.16 Total Graduate Enrollment by Citizenship, Race/Ethnicity, and Gender, 2010 to 2020 (Excel, PDF)
Table C.17 Total Graduate Enrollment by Broad Field, 2010 to 2020 (Excel, PDF)
Table C.18 Total Graduate Enrollment by Broad Field and Attendance Status, 2010 to 2020 (Excel, PDF)
Table C.19 Total Graduate Enrollment by Broad Field and Citizenship, 2010 to 2020 (Excel, PDF)
Table C.20 Total Graduate Enrollment by Broad Field and Race/Ethnicity, 2010 to 2020 (U.S. Citizens and Permanent Residents Only) (Excel, PDF)
Table C.21 Total Graduate Enrollment by Broad Field and Gender, 2010 to 2020 (Excel, PDF)
Table C.22 Doctorate-Level Total Enrollment by Broad Field and Gender, 2010 to 2020 (Excel, PDF)
Table C.23 Master’s-Level Total Enrollment by Broad Field and Gender, 2010 to 2020 (Excel, PDF)
Table C.24 Graduate Degrees and Certificates Awarded by Degree Level and Institution Type, 2009-10 to 2019-20 (Excel, PDF)
Table C.25 Graduate Degrees and Certificates Awarded by Degree Level and Carnegie Classification, 2009-10 to 2019-20 (Excel, PDF)
Table C.26 Graduate Degrees and Certificates Awarded by Degree Level, Institution Type, and Gender, 2009-10 to 2019-20 (Excel, PDF)
Table C.27 Graduate Degrees and Certificates Awarded by Degree Level, Carnegie Classification, and Gender, 2009-10 to 2019-20 (Excel, PDF)
Table C.28 Graduate-Level Certificates Awarded by Broad Field and Gender, 2009-10 to 2019-20 (Excel, PDF)
Table C.29 Master’s Degrees Awarded by Broad Field and Gender, 2009-10 to 2019-20 (Excel, PDF)
Table C.30 Doctoral Degrees Awarded by Broad Field and Gender, 2009-10 to 2019-20 (Excel, PDF)
A list of downloadabe figures and tables for "CGS Research-in-Brief: Impact of COVID-19 on Graduate Education Access."
APRIL 15, 2021 | CGS Research-in-Brief
By Janet Gao, Research and Program Associate, Council of Graduate Schools
Since the onset of the COVID-19 pandemic, concerns on graduate education access and success have not gone unnoticed (Flaherty, 2020a, 2020b). To examine how prospective students and enrollment management professionals may be responding to the pandemic, the Council of Graduate Schools (CGS), in partnership with NAGAP, The Association for Graduate Enrollment Management, fielded the 2020 NAGAP/CGS Survey of Graduate Enrollment Management Professionals. The survey, which was sent to active NAGAP members in November and December 2020, asked a series of questions, including U.S. graduate enrollment trends in Fall 2020, outreach efforts, and graduate school pipeline issues, among other topics. A total of 217 GEM professionals working across the graduate schools, university office of admissions, professional schools, academic colleges, and academic programs responded to the survey. Approximately 60% of them identified themselves as lead GEM professionals on their campuses. (Figure 1)
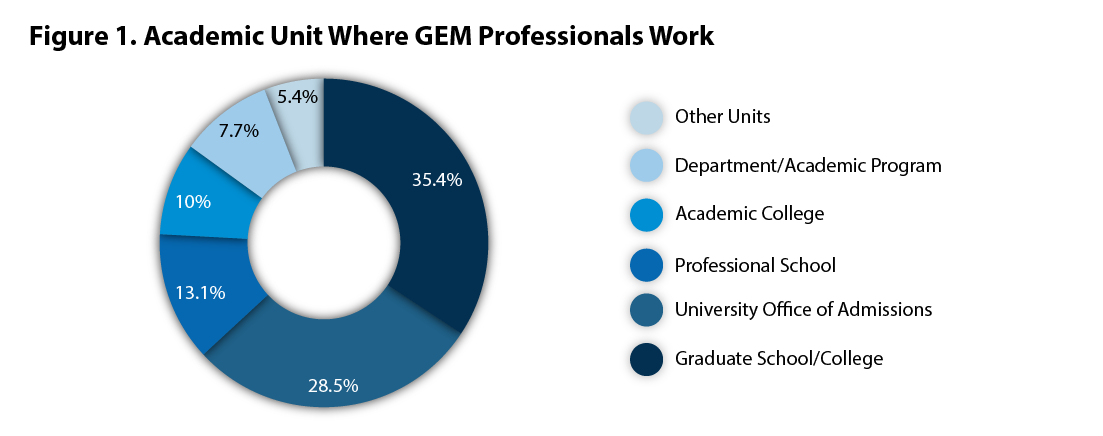
Data Source: NAGAP, The Association for Graduate Enrollment Management & Council of Graduate Schools, Survey of Graduate Enrollment Management Professionals, Fall 2020, Data Table 1.
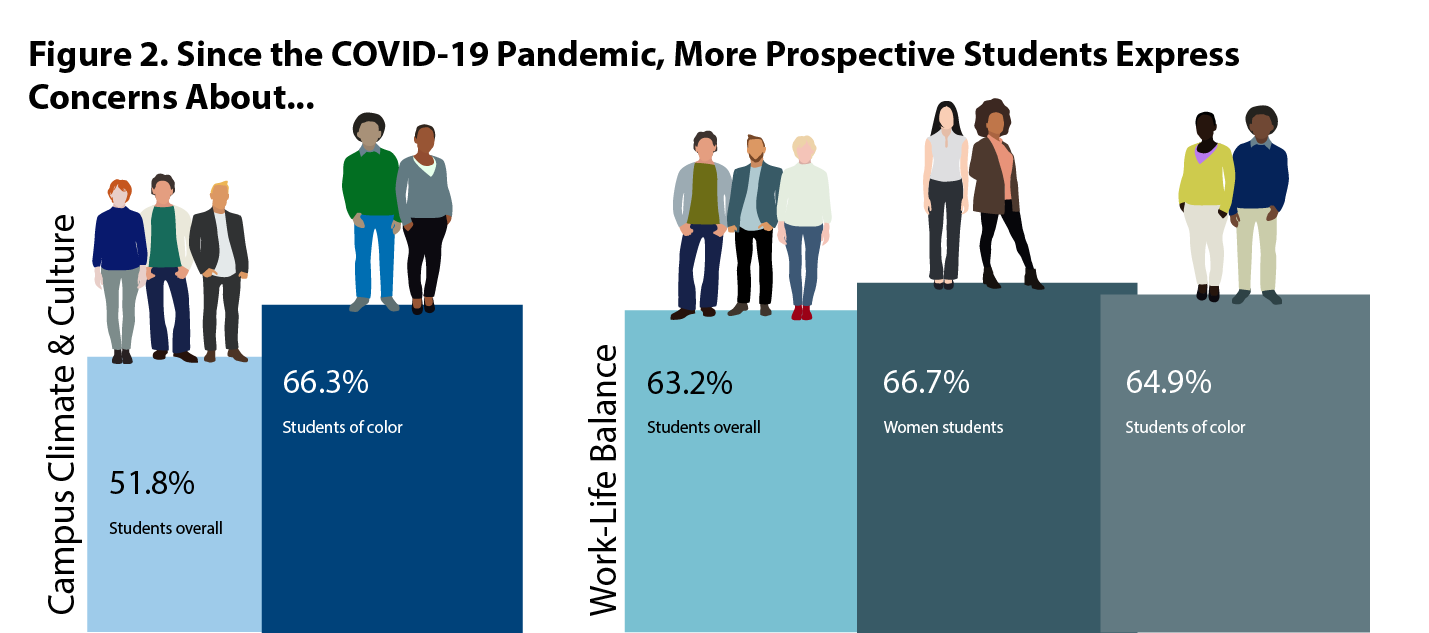
Data Source: NAGAP, The Association for Graduate Enrollment Management & Council of Graduate Schools, Survey of Graduate Enrollment Management Professionals, Fall 2020, Data Table 2.
.png)
Data Source: NAGAP, The Association for Graduate Enrollment Management & Council of Graduate Schools, Survey of Graduate Enrollment Management Professionals, Fall 2020, Data Table 3.
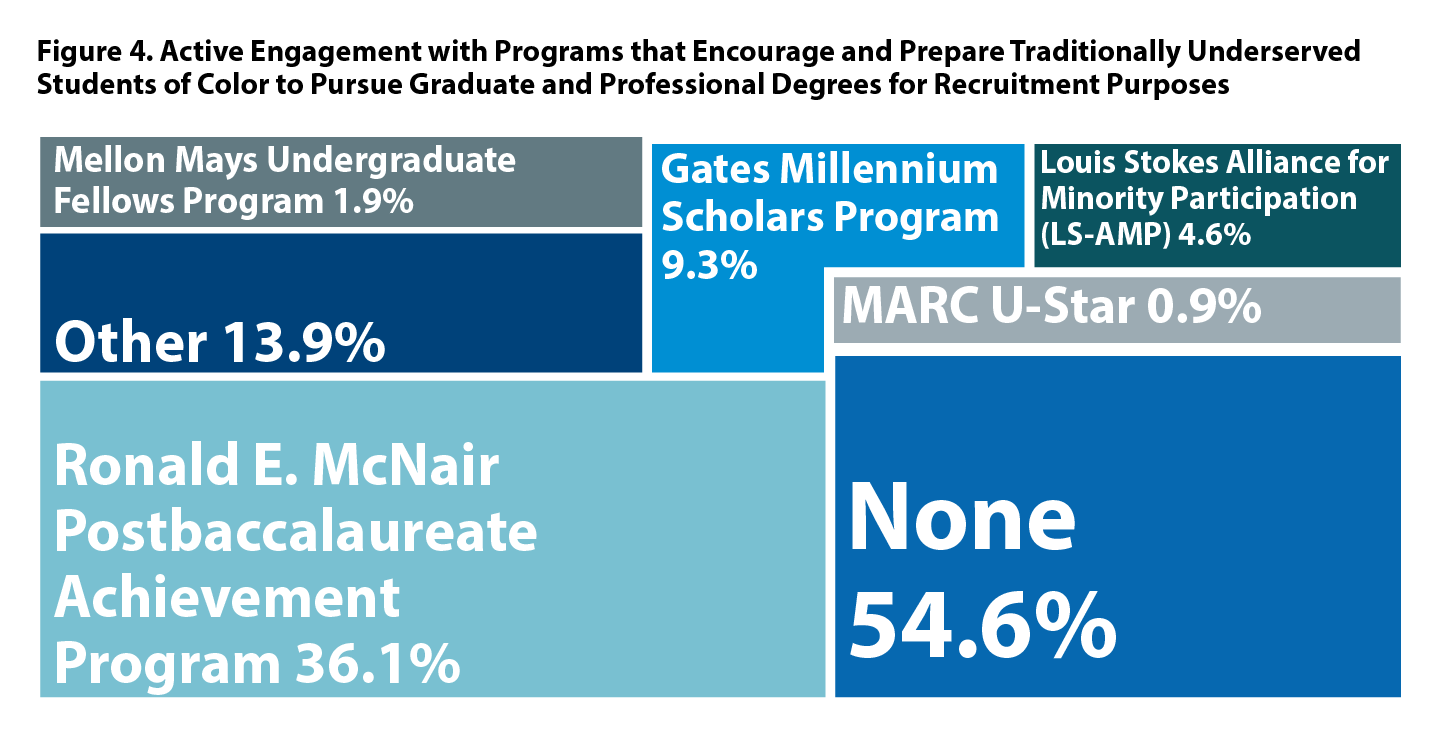
Data Source: NAGAP, The Association for Graduate Enrollment Management & Council of Graduate Schools, Survey of Graduate Enrollment Management Professionals, Fall 2020, Data Table 4.
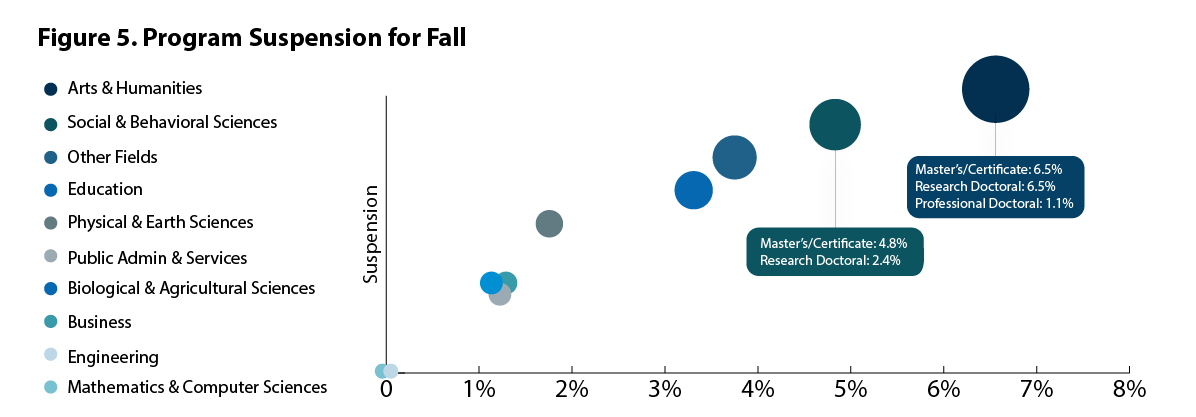
Data Source: NAGAP, The Association for Graduate Enrollment Management & Council of Graduate Schools, Survey of Graduate Enrollment Management Professionals, Fall 2020, Data Table 5.
Consistent with the pre-pandemic time, affordability of graduate education continues to be a concern among both prospective graduate students and graduate schools. The availability of financial incentives to maintain students’ interest is considered one of the most compelling drivers of graduate enrollment.
There appears to be a growing question about the value proposition of graduate education. Making the connection between graduate programs and potential career outcomes is more important than ever. National efforts such as the CGS Understanding PhD Career Pathways for Program Improvement Project, AHA Career Diversity for Historians Initiative, and the Coalition for Next Generation Life Science support graduate institutions and programs to better communicate the career opportunities and outcomes of their graduates.
The survey data suggest that programs designed to encourage and prepare traditionally underserved students to pursue graduate and professional degrees were utilized by less than half of GEM professionals. Efforts such as National Name Exchange and McNair Scholars List are available platforms and resources for graduate institutions and programs to identify a pool of qualified underrepresented graduate students to successfully recruit, develop and retain.
Consistent with other reports (Flaherty, 2020b; Zahneis, 2020), there has been a temporary moratorium on academic programs, particularly in some of the arts & humanities and social & behavioral sciences fields. Admission suspensions, as well as enrollment size reductions, will likely have a longer-term impact (Zahneis, 2021).
Beyond the data points shared in this brief, the graduate education community also faces a larger volume of deferred admissions of international graduate students (Zhou & Gao, 2021), which may interfere with the continuing cohort and new enrollment in the 2021 admissions cycle and beyond. This is another challenge graduate schools and programs, and GEM professionals, likely face in the coming months.
In response to COVID-19, what efforts do your institution and graduate programs take to maximize funding and career resources that increase access for prospective graduate students while ensuring success for current graduate students?
How are your institution and graduate programs re-envisioning and revising plans, strategies, and efforts that enforce diverse and inclusive virtual learning environments for minority students and accommodate female students with other needs or demands?
How do you evaluate the effectiveness of these approaches and resources in motivating and engaging prospective graduate students?
How do your institution and graduate programs plan to provide continuous support to retain and reboot graduate enrollment in a post-pandemic future?
Flaherty, C. (2020a, April 7). What About Graduate Students? Inside Higher Ed. Retrieved from https://www.insidehighered.com/news/2020/04/07/graduate-students-seek-time-degree-and-funding-extensions-during-covid-19
Flaherty, C. (2020b, June 1). Pausing Grad Admissions. Inside Higher Ed. Retrieved from https://www.insidehighered.com/news/2020/06/01/some-departments-plan-suspending-or-limiting-graduate-cohorts-year-or-longer-free
Zahneis, M. (2020, September 28). More Doctoral Programs Suspend Admissions. That Could Have Lasting Effects on Graduate Education. The Chronicle of Higher Education. Retrieved from https://www.chronicle.com/article/more-doctoral-programs-suspend-admissions-that-could-have-lasting-effects-on-graduate-education
Zahneis, M. (2021, February 15). The Shrinking of the Scholarly Ranks. The Chronicle of Higher Education. Retrieved from https://www.chronicle.com/article/the-shrinking-of-the-scholarly-ranks
Zhou, E., & Gao, J. (2021). International Graduate Applications & Enrollment: Fall 2020. Council of Graduate Schools.
The brief was prepared by Janet Gao, under the direction of Hironao Okahana. J.G. conducted data collection and preparation, analysis of the data, and prepared an initial draft. H.O. directed the underlying research activities for the 2020 NAGAP/CGS Survey of Graduate Enrollment Management and supervised the analysis for this work. The survey was administered in partnership with NAGAP, The Association for Graduate Enrollment Management, with support from Liaison International.
Special thanks to Suzanne T. Ortega and NAGAP Leadership Team for feedback on earlier drafts. Many thanks to Harper Garfinkle for her contribution in data visualization, Matthew Linton for preparation of the final product, and with Liaison International for their financial support for this survey.
Figure 1. Total International Graduate Applications by Degree Type, Fall 2017 to Fall 2020 (PDF, Image)
Figure 2. First-time International Graduate Enrollment by Degree Type, Fall 2017 to Fall 2020 (PDF, Image)
Figure 3. Factors Institutions Believe are Associated with Increased International Student Deferrals (PDF, Image)
Figure 4. First-time Enrollment & Deferred Admissions of Chinese and Indian Nationals, Fall 2020 (PDF, Image)
Figure 5. One-year Change in International Graduate Applications & First-time Enrollment by Selected Country & Region of Origin between Fall 2019 and Fall 2020 (PDF, Image)
Table A.1 Annual Changes in Final International Graduate Applications by Region/Country of Origin, Fall 2015 to Fall 2020 Admission Cycles (PDF, Excel, Image)
Table A.2 Annual Changes in First-time International Graduate Enrollment by Region/Country of Origin, Fall 2015 to Fall 2020 Admission Cycles (PDF, Excel, Image)
Table A.3 Annual Changes in Final International Graduate Applications by Field of Study, Fall 2015 to Fall 2020 Admission Cycles (PDF, Excel, Image)
Table A.4 Annual Changes in First-time International Graduate Enrollment by Field of Study, Fall 2015 to Fall 2020 Admission Cycles (PDF, Excel, Image)
Table B.1 Final International Graduate Applications by Region/Country of Origin, Fall 2020 Admission Cycle (PDF, Excel, Image)
Table B.2 Offers of Admission to International Graduate Applicants by Region/Country of Origin, Fall 2020 Admission Cycle (PDF, Excel, Image)
Table B.3 First-time International Graduate Enrollment by Region/Country of Origin, Fall 2020 Admission Cycle (PDF, Excel, Image)
Table B.4 Deferred Admissions and First-time International Graduate Enrollment as Percentage Shares of Offers of Admission by Region/Country of Origin, Fall 2020 Admission Cycle (PDF, Excel, Image)
Table B.5 Total International Graduate Enrollment by Region/Country of Origin, Fall 2020 Admission Cycle (PDF, Excel, Image)
Table C.1 Final International Graduate Applications by Field of Study, Fall 2020 Admission Cycle (PDF, Excel, Image)
Table C.2 Offers of Admission to International Graduate Applicants by Field of Study, Fall 2020 Admission Cycle (PDF, Excel, Image)
Table C.3 First-time International Graduate Enrollment by Field of Study, Fall 2020 Admission Cycle (PDF, Excel, Image)
Table C.4 Deferred Admissions and First-time International Graduate Enrollment as Percentage Shares of Offers of Admission by Field of Study, Fall 2020 Admission Cycle (PDF, Excel, Image)
Table C.5 Total International Graduate Enrollment by Field of Study, Fall 2020 Admission Cycle (PDF, Excel, Image)
Table D.1 Characteristics of Institutions with Valid Responses for the Fall 2020 First-time Enrollment (PDF, Excel, Image)
Table D.2 Characteristics of Institutions with Valid Responses for the Fall 2019 and Fall 2020 First-time Enrollment (PDF, Excel, Image)
PRESS RELEASE
Contact: Katherine Hazelrigg (202) 461-3888 / khazelrigg@cgs.nche.edu
Graduate Applications Flat, First-time Enrollment on the Rise Overall
Washington, DC — Graduate degree holders representing diverse backgrounds will play a key role in driving innovation and discovery in the U.S. workforce, and new data from the Council of Graduate Schools (CGS) on graduate enrollments and degrees provide a revealing snapshot of the country's progress in meeting these demands. According to a CGS report released today, graduate applications were flat (-0.6%) and first-time graduate enrollment (2.5%) increased overall for the Fall 2019 semester. While graduate schools reported overall increases in the first-time enrollment of minority students between Fall 2018 and Fall 2019 (Latinx +5.7%, Black/African American +5.5%, Asian +5.3%, and American Indian/Alaska Native +3.5%), students from these demographic groups remain substantially underrepresented as percentage shares of the graduate student population, particularly in STEM fields. These data are part of the latest CGS/GRE Graduate Enrollment & Degrees: 2009-2019 report.
“The growth in first-time enrollment rates for a second year, along with the continued increases in first-time enrollment among Latinx, Black/African Americans, Asians/Pacific Islanders, and American Indian/Alaska Natives graduate students are encouraging,” said CGS President Suzanne Ortega. “But we still have so much work to do. I’m particularly concerned about the disproportionate economic effects of the COVID-19 pandemic on underrepresented minorities (URM). The modest gains the U.S. has seen over the past ten years in URM and first-generation graduate student enrollment and degree completion are in real jeopardy.”
In an effort to examine the obstacles URM students have faced in their matriculation, persistence, and completion of STEM graduate programs in the wake of the COVID-19 pandemic, CGS, the Council for Opportunity in Education (COE) and the Council of Historically Black Graduate Schools (CHBGS) are collaborating on an NSF-funded RAPID Investigating Challenges to Matriculation and Completion for Underrepresented STEM Graduate Students during the COVID-19 Pandemic. According to Ortega, “The pandemic has introduced a new set of challenges that we need to understand and be prepared to address quickly, but there are a number of things we already know we could be doing better, including recruiting and retaining a more diverse faculty, fostering a more inclusive learning environment, and addressing the financial barriers to degree completion.”
First-time Enrollment in Engineering Rebounds, Continued Growth in Health Sciences and Mathematical and Computer Sciences
After declining in the previous four years, first-time enrollment in Engineering increased 4.8% at the doctoral level and 5.1% at the master’s level between Fall 2018 and Fall 2019. The overall growth in first-time enrollment of international students (3.8%) contributed to rebound in engineering fields, which reported a 3.3% increase in international students. Other trends by broad field of study are generally consistent with the last few years. In addition to the broad field of Engineering, the largest one-year gains in first-time enrollment by broad field of study were in Mathematics and Computer Sciences (5.7%), Health Sciences (3.5%), and Other Fields (6.9%). In contrast, first-time graduate enrollment in Education over the same period flattened (+0.4%) after previous years of growth.
Institutions responding to the CGS/GRE Survey of Graduate Enrollment & Degrees for Fall 2019 enrolled more than 1.8 million graduate students. Nearly three quarters (73.5%) of total graduate enrollment was in master’s programs. Over one million of those graduate students, or 58.5%, were women. The three largest broad fields of study (education, business, and health sciences) were also the fields with the largest proportions of part-time graduate students (Ed: 63.7%; Bus: 51.7%; HSci: 41.2%).
About the report
Graduate Enrollment and Degrees: 2009 to 2019 presents the findings of an annual survey of U.S. graduate schools, co-sponsored by CGS and the Graduate Record Examinations (GRE) Board. It is the only annual national survey that collects data on graduate enrollment by all fields of study and is the only source of national data on graduate applications by broad field of study. The report includes responses from 561 institutions and presents statistics on graduate applications and enrollment for Fall 2019, degrees conferred in 2018-19, and trend data for one-, five- and ten-year periods.
###
The Council of Graduate Schools (CGS) is an organization of approximately 500 institutions of higher education in the United States and Canada engaged in graduate education, research, and the preparation of candidates for advanced degrees. The organization’s mission is to improve and advance graduate education, which it accomplishes through advocacy in the federal policy arena, research, and the development and dissemination of best practices.
February 12, 2020
The Council of Graduate Schools (CGS) has published new data showing that international graduate application and first-time enrollment rates have increased at U.S. universities for the first time since Fall 2016. For Fall 2019, the final application counts from prospective international students increased by 3%, and the first-time enrollment of international graduate students increased by 4%. The proportion of first-time international graduate enrollment in master’s and certificate programs (75%) vs. doctoral programs (25%) has remained roughly the same.
JUNE 3, 2020 | CGS Research-in-Brief
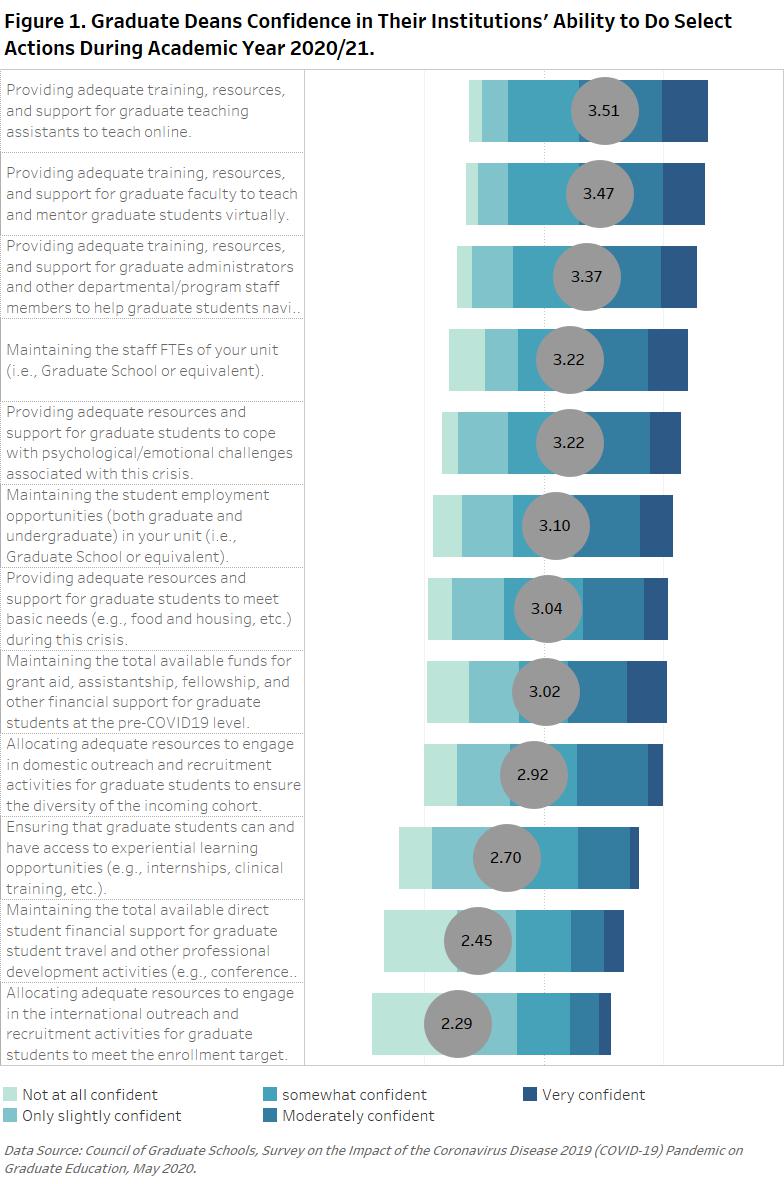
The Council of Graduate Schools (CGS) fielded the Survey on the Impact of the Coronavirus Disease 2019 (COVID-19) Pandemic on Graduate Education to its member institutions. The survey was electronically disseminated to 456 CGS Regular Member institutions based in the United States and Canada between May 4 and 11, 2020. A total of 201 responses, or the response rate of 44%, was recorded. Public institutions, as well as Doctoral Universities-Very High Research Activity (R1) institutions, were overrepresented among the respondents. The below brief summarizes the aggregated, unweighted findings from the survey. The full frequency tables, including the questionnaire items and descriptive characteristics of responding institutions, can be found in the appendix.
Immediate Plans & Decisions Made to Date
Check out the CGS statement on graduate admissions during the COVID-19 pandemic.
Has your institution transitioned dissertation camps or other place-based writing retreats for graduate students to a virtual format? Share with you colleagues how you have done it!
Check out the CGS webinar, Moving to a Virtual Space: How to Create Virtual Graduate Student Orientations.
How are you planning for virtual new student orientations? What will you be doing over the summer to stay in touch with incoming graduate students? Share with your colleagues what you are planning!
Keep yourself apprised of federal policy updates related to the COVID-19 pandemic, as well as sign up to receive our weekly Washington Insights & Highlights.
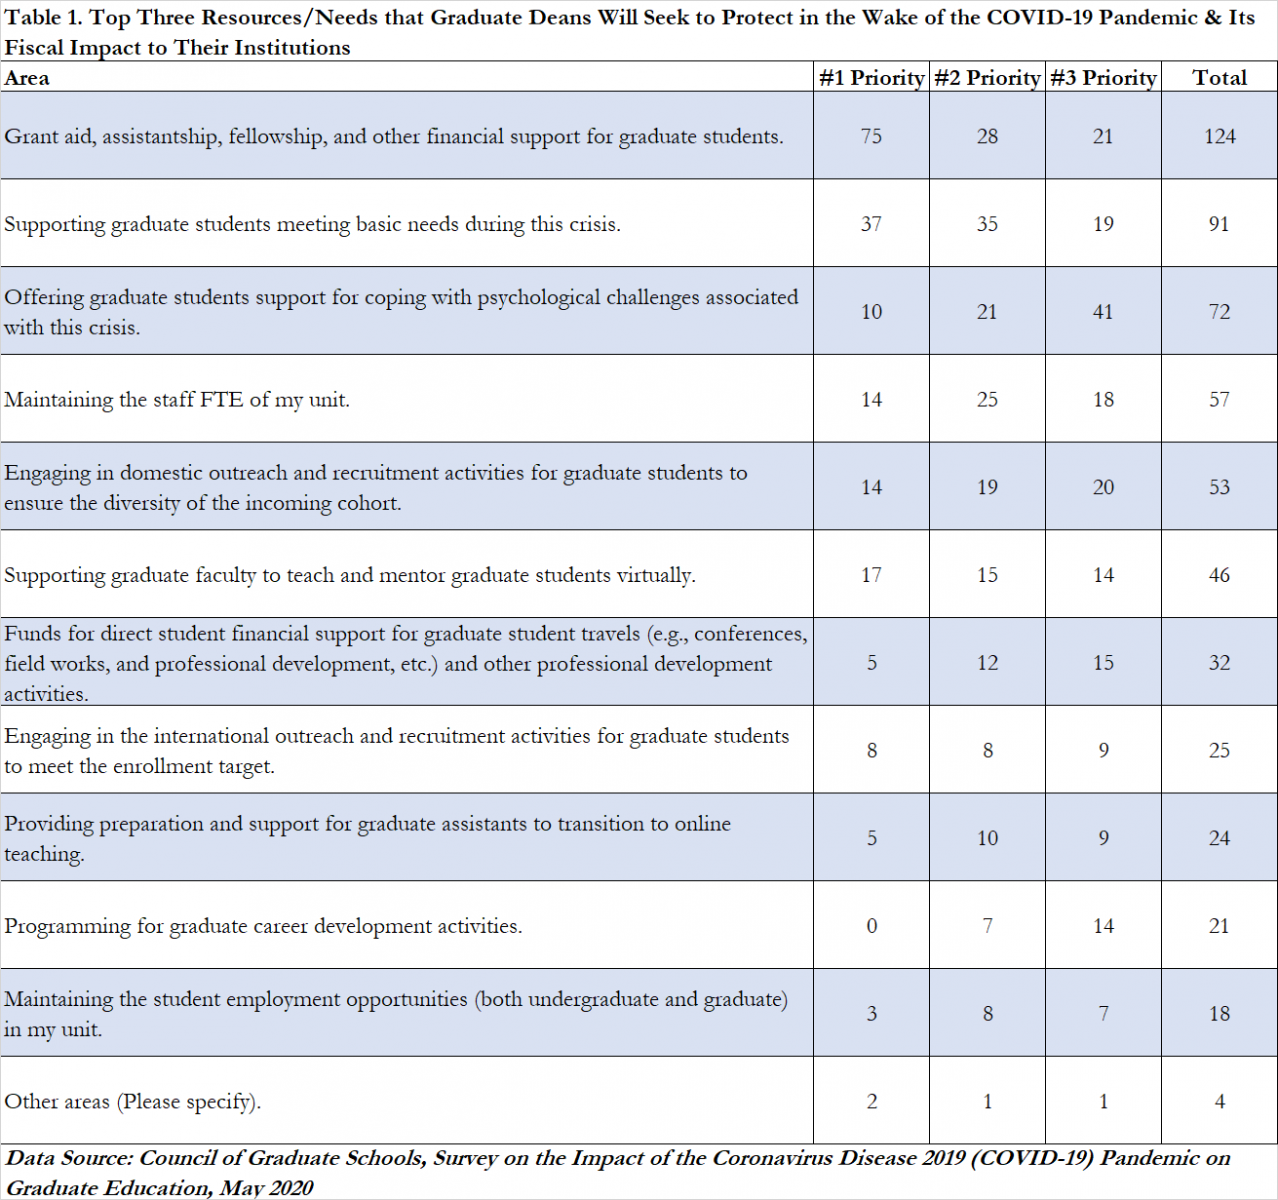
Outlook for AY2020/21 and Priorities
Be sure to register for the upcoming virtual Summer Workshop, learn from experts and your peers about how to navigate some of the challenges, such as supporting international graduate students, offering career development opportunities and experiential learning opportunities for graduate students during the pandemic.
CGS also offers various platforms for member institutions to learn from each other as we navigate the pandemic together, and we encourage you to bookmark our COVID-19 resource page as a one-stop shop. The page features various U.S. government guidance, as well as resources page put together by some of the CGS member institutions. You can also directly engage other CGS members via the Dean’s Discussion Board, where you can ask questions to your peers and also to weigh in on questions from others.
Author Contribution and Acknowledgment
The brief was prepared by Hironao Okahana. CGS President Suzanne T. Ortega, the Leadership Team, Research Team, and Research and Information Services Committee provided feedback to the data collection instrument, as well as on the write-up. Enyu Zhou and Janet Gao contributed to the preparation of the annotated questionnaire document.
###
FOR IMMEDIATE RELEASE
Contact: Katherine Hazelrigg (202) 461-3888 / khazelrigg@cgs.nche.edu
While overall rates are up, some universities continue to see declines
Washington, DC —The Council of Graduate Schools (CGS) has published new data showing that international graduate application and first-time enrollment rates have increased at U.S. universities for the first time since Fall 2016. For Fall 2019, the final application counts from prospective international students increased by 3%, and the first-time enrollment of international graduate students increased by 4%. The proportion of first-time international graduate enrollment in master’s and certificate programs (75%) vs. doctoral programs (25%) has remained roughly the same.
The growth is driven primarily by increases in applications (3%) and first-time enrollment (4%) to master’s and certificate programs. While the overall increases are welcome news, some institutions did not see more student interest. For Doctoral Universities with Highest Research Activity (R1) and Master’s Colleges and Universities and Other Institutions (M1-3), applications and first-time enrollment increased across the board. However, for Doctoral Universities with Higher or Moderate Research Activity (R2 & R3), first-time enrollment declined in doctoral programs (-6%) and stagnated in master’s and certificate programs (-1%).
“We are pleased to see that the overall application and first-time enrollment numbers for international graduate students are on the rise. Our member universities work hard to ensure a welcoming environment for students and scholars from across the globe,” said CGS President Suzanne Ortega. “We remain vigilant, however, in monitoring obstacles, including the latest Executive Order “travel ban” and other changes in immigration and visa policy, that may negatively impact our ability to attract talented students from around the world.”
Highlights by Country of Origin
China and India continue to represent the largest shares of international graduate applications, first-time international graduate enrollments, and total international graduate enrollments. Between Fall 2018 and Fall 2019, the number of graduate applications and first-time graduate enrollments for Chinese nationals increased by 3%.
This is the second consecutive year of strong growth in graduate applications (11%) and first-time enrollments (22%) from sub-Saharan African students to U.S. graduate schools. While after two years of decline, applications (4%) and first-time enrollments (10%) from Mexican nationals rose.
Highlights by Field of Study
Across broad fields of study, international graduate applications increased in arts and humanities (6%), health sciences (7%), mathematics and computer sciences (7%), and biological and agricultural sciences (14%) between Fall 2018 and Fall 2019. By contrast, applications in engineering (-2%) and business (-3%), two of the largest broad fields of study, decreased. The largest one-year increases in first-time international graduate enrollment by broad field of study were in mathematics and computer sciences (11%), social and behavioral sciences (11%), and biological and agricultural sciences (10%).
About the survey and report
Conducted since 2004, the CGS International Graduate Admissions Survey tracks the applications and enrollments of international students seeking U.S. master’s and doctoral degrees. As the only report of its kind to offer data on the current academic year, International Graduate Applications and Enrollment: Fall 2019 reports applications, admissions, and enrollments of international master’s, certificate, and doctoral students at U.S. colleges and universities. In Fall 2016 the survey was redesigned to collect data by degree objective (master’s and graduate certificate vs. doctorate), and for all seven regions of origin, eight countries of origin, and all eleven broad fields of study, yielding the only degree-level data currently available for graduate admissions and enrollments. 403 U.S. graduate institutions who are members of CGS or its regional affiliates responded to the 2019 survey.
###
The Council of Graduate Schools (CGS) is an organization of approximately 500 institutions of higher education in the United States and Canada engaged in graduate education, research, and the preparation of candidates for advanced degrees. The organization’s mission is to improve and advance graduate education, which it accomplishes through advocacy in the federal policy arena, research, and the development and dissemination of best practices.
![]()