

Thank you for visiting CGS! You are currently using CGS' legacy site, which is no longer supported. For up-to-date information, including publications purchasing and meeting information, please visit cgsnet.org.
Benchmarking

CGS is the leading source of information, data analysis, and trends in graduate education. Our benchmarking data help member institutions to assess performance in key areas, make informed decisions, and develop plans that are suited to their goals.
Introduction
Diversity in graduate education, particularly in science, technology, engineering, and mathematics (STEM) fields is an issue of critical importance to the graduate education enterprise, as well as scientific community in the United States. Although the progress has been made to advance participation of traditionally underrepresented minorities1 (URMs) in STEM graduate education, a lack of parity remains in comparison to White, Asian, and international students. According to the most recent CGS/GRE Survey of Graduate Enrollment and Degrees (Allum & Okahana, 2015), 19% of the 2014 first-time graduate enrollments in STEM fields were URM students. In addition, the most recent Survey of Earned Doctorates (National Science Foundation, 2015) reported that 13% of all STEM doctorates conferred to U.S. citizens and permanent residents in 2014 were awarded to URM students. This is in contrast to the fact that 36% of the U.S. population between the ages of 25 and 34 are URMs (U.S. Census Bureau, 2014). In the STEM workforce, the gap is more obvious as URMs comprise only 7% of the STEM doctoral workforce (National Science Board, 2015).
While overall enrollment of URM students in STEM fields is on the rise (Allum & Okahana, 2015), more needs to be done to ensure that the U.S. STEM workforce, including the professoriate, reflect the diversity of the communities which they serve and the nation as a whole. Also, studies on graduate education are much needed in order to address America’s national capacity to innovate and to prepare graduate students to compete on a global scale (Walker, Jones, Golde, Conklin Bueschel & Hutchings, 2008; Council of Graduate Schools and Educational Testing Service, 2010 and 2012; Gumport 2011).
With generous support from the National Science Foundation (NSF), the Council of Graduate Schools (CGS) has embarked upon an effort to examine patterns of completion and attrition among URM doctoral students in STEM fields and to explore factors likely to affect their ability to complete their doctoral program. The project, Completion and Attrition in AGEP and non-AGEP Institutions (NSF grant #1138814), collected the largest dataset of its kind, encompassing student-level data and other qualitative data from twenty-one U.S. graduate schools with large STEM doctoral offerings (Sowell, Allum, & Okahana, 2015).
In April 2015 the selected findings from the project were release in a CGS publication, Doctoral Initiative on Minority Attrition and Completion (Sowell et al., 2015). Subsequently, findings and implications of the publication were discussed at the Spring 2015 CGS Research and Policy Forum, which was held in Washington, DC on May 28, 2015. This paper summarizes the proceeding from the forum, in which four authors of this paper participated as speakers. The paper begins with a discussion of URM STEM doctoral completion and attrition rates and programs and initiatives aimed at facilitating success of URM STEM doctoral students, followed by a discussion on directions for future research, and concluding remarks.
National Benchmark for URM STEM Doctoral Completion
As a benchmarking tool, Sowell et al. (2015) is one of the most robust resources available to U.S. graduate schools to describe URM STEM doctoral completion. According to the data collected as a part of the project, the ten-year degree completion rate for URM students in STEM fields was 54% (Sowell, et al., 2015). Although this is not a direct comparison, the result is very close to the 55% ten-year completion rate for all domestic students in STEM fields reported in the CGS’ PhD Completion project (Sowell, Zhang, Bell, & Redd, 2008). While the participation of URM students in STEM doctoral programs lags behind non-URM students, the data in aggregate suggests that once URM students are in doctoral programs, their success is equally as likely as that of non-URM students.
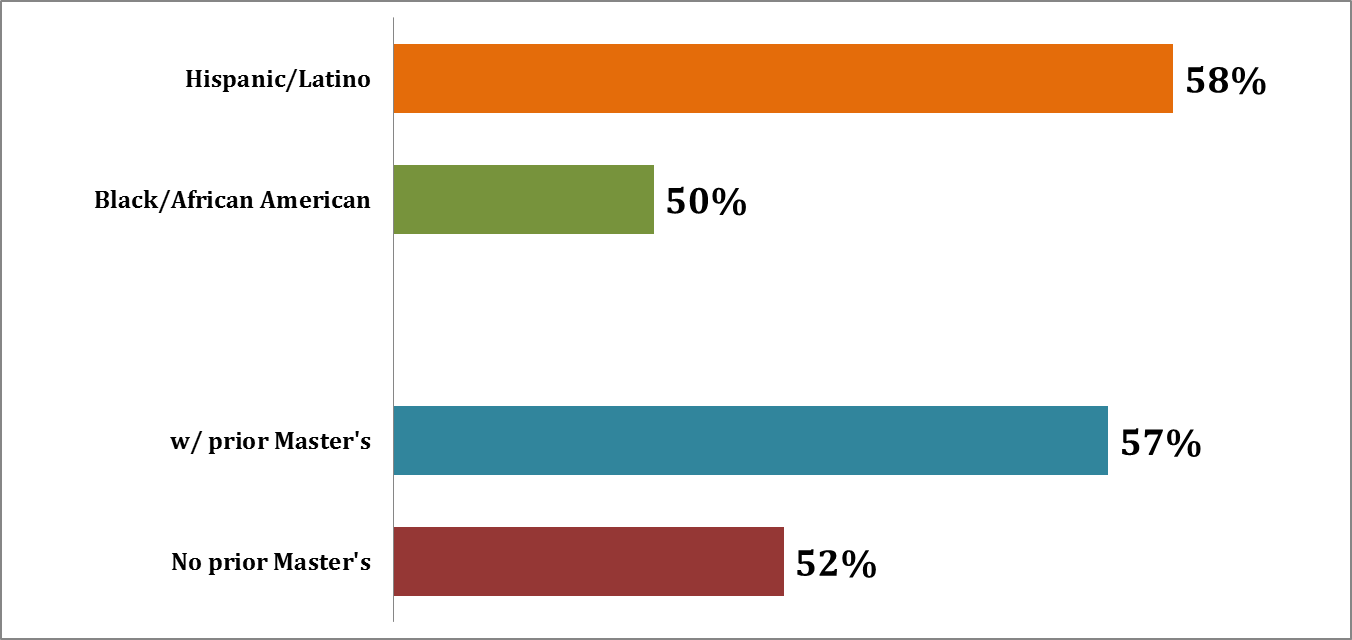
It is important to highlight the fact that within the URM student body, completion rates varied by student characteristics, such as gender, race/ethnicity, broad fields of study, and prior master’s degree status. For example, URM women had a higher STEM doctoral completion rate than their male counterparts (56% and 52%, respectively), and Hispanic/Latino students had a higher STEM doctoral completion rate than their Black/African American counterparts (58% and 50%, respectively). Even after controlling for broad fields of study and prior master’s degrees awarded, these differences between men and women, and Black/African American students and Hispanic/Latino students appear to persist.2 Findings of this project corroborate much of the prior literature, which tends to focus on URM educational attainment up to the baccalaureate level (See College Board, 2010, Lee & Ransom, 2011, Harper, 2006 for examples), suggesting that men and Black/African Americans are among the more vulnerable subsets of the URM population in terms of educational attainment.
Figure 1: 10-year Doctoral Completion Rates of URM STEM Students3
The differences in completion and attrition rates between broad fields were also notable (Sowell et al., 2015). URM doctoral students in life sciences fields reported the highest ten-year completion rate (63%), followed by students in engineering fields (56%), social & behavioral sciences fields (52%), and physical & mathematical sciences fields (45%). One potential explanation for the low completion rate of physical & mathematical sciences fields may be in the workforce. According to NSF’s most recent National Survey of College Graduates (NSCG:13), the median earnings for recent doctoral graduates and master’s graduates in physical & mathematical sciences fields are the same.4 In other words, in aggregate, the potential earnings premium for attaining doctoral degrees in physical & mathematical sciences fields may not be as great as other fields of study. This could partially explain relatively low completion and high attrition rates for this broad field of study, as students might be choosing the workforce after earning their passing master’s degrees. This also suggests that not all attrition is “bad” as withdrawn students may be gainfully employed in areas of their study without a doctorate.
Finally, URM students with prior master’s degrees also reported higher doctoral completion rates in STEM fields than those who have entered doctoral programs without prior master’s degree. This is not surprising as correlation between prior graduate education and doctoral completion has been discussed in prior studies (See Edwards Lange, 2010; Sowell, Bell, Francis, & Goodwin, 2010, both cited in Sowell et al., 2015). A potential implication of this finding may be significant as it suggests that master’s education may be a viable pathway for URM students toward successful doctoral experience. In light of further disinvestment in financial support for master’s education, this poses a compelling reason to reverse the course.
In addition to informing the national policy on STEM doctoral completion for URM students, the data accumulated in this project is also a useful benchmarking tool for graduate schools. Each of the twenty-one participating institutions was given institutional data alongside with the aggregated data for the all participating institutions. These institutional reports allow them to examine their own enrollment and degree completion figures to determine trends, and perform program and policy analyses. For example, institutions may employ these data to ask questions such as, “If a surge in enrollment during a certain period was due to significant recruitment at the National Society of Black Engineers (NSBE), the Society for the Advancement of Chicanos/Hispanics and Native American in Science (SACNAS), award of a diversity capacity building grant, or similar action,” and “If there were fewer graduates in a certain time frame due to the loss of a diversity champion.” Since the data collection instruments, as well as full report are publicly available, non-participating institutions can duplicate their own data collection efforts and benchmark their enrollment and completion data against the findings.
Programs that Support URM Doctoral Success
During the course of the Completion and Attrition in AGEP and non-AGEP Institutions project, the data collections efforts have also served as a vehicle to facilitate discussions among key campus stakeholders about this important topic. Subsequent findings discussed in Sowell et al. (2015) provide a valuable foundation as campus stakeholders make cases for programs and resources that support URM STEM doctoral students. For example, at the University of Maryland at Baltimore County (UMBC), the results from the project helped make a case for continuing programming such as the PhD Candidacy Ceremony. The PROMISE AGEP Summer Success Institute and Professors-in-Training workshops, as well as the Dissertation House have also been sustained, as they allow internal and external faculty mentors and champions who provide academic, holistic, and motivational professional development workshops (e.g., teaching with technology, financial education, career-life balance, psychological well-being). Further, implementation of “The Jessica Effect” which welcomes families to all PROMISE AGEP events at UMBC, and programs that promote peer networks have also been good investments.
More broadly, Sowell et al. (2015) found that the most of programs and interventions, which are aimed to facilitate completion of STEM doctoral programs among URM students, tend to be early interventions that focus on recruitment, selection, and first-year transition of new students. The findings also suggested that in the latter stages of the doctoral process, students often rely on more informal support mechanisms, such as peer supports, mentorships, advocates/champions, and personal determination. While the project did not collect the comparative data on experience of non-URM doctoral students, it is widely understood that challenges and rigor of STEM doctoral education may be compounded for URM students. Sowell et al. (2015) found that STEM doctoral process is intensive, solitary, and often complicated experience for URM students. The study also suggested that students who have advanced to candidacy were more likely to be skeptical with faculty or graduate programs ability to address URM issues. They were also more likely to be concerned of their mental health and felt isolated from other students. These findings, in aggregate, point that organizing support and resources for doctoral students in late stages, such as UMBC’s Candidacy Ceremony and Dissertation House, may be particularly useful concepts in addressing successful completion of URM doctoral students in STEM fields.
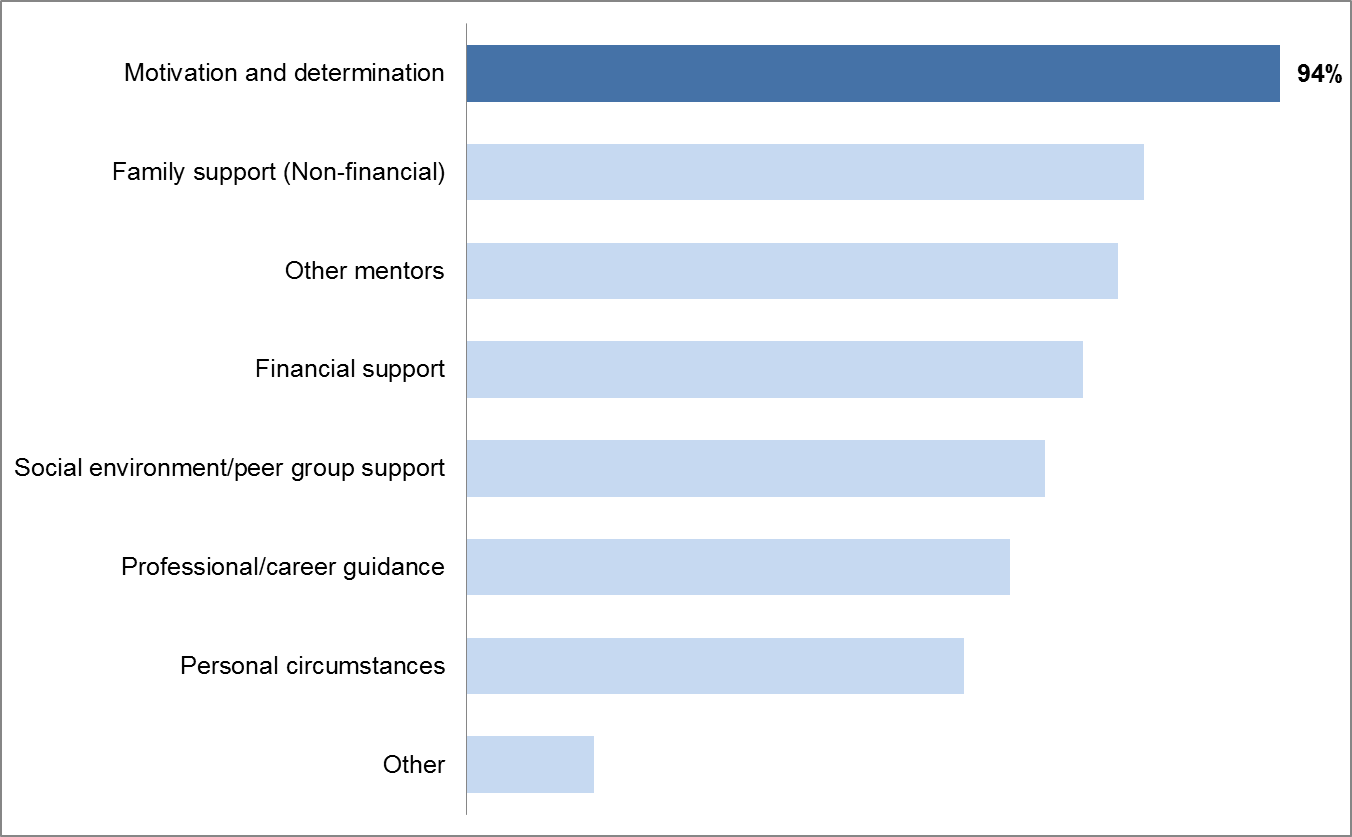
Additionally, results discussed in Sowell et al. (2015) reiterate the importance of further engaging graduate schools in the topic of URM participation and completion in STEM doctoral programs. For example, Sowell et al. (2015) showed that the doctoral student survey respondents felt that faculty were largely unaware of the issues that underrepresented students face. Facilitating discussions at levels such as meetings of faculty and deans, and sponsoring opportunities for faculty to participate in diversity conversations at national conferences could increase awareness of issues. Sowell et al. (2015) also found evidence to suggest that doctoral students were more affected by their program’s climate than their advisor and faculty support. Motivation and determination was the number one personal factor affecting achievement of degree objectives (see Figure 2). This evidence suggests that developing or replicating constructs that include these elements could be transformative.
Figure 2: Factors that Influenced URM STEM Students’ Ability to Stay in Doctoral Programs5
The report also noted that constant turnovers of leadership make it difficult to sustain student-led initiatives and efforts that aim to facilitate success for URM STEM doctoral students. Thus, institutionalized support mechanisms that support such efforts may be a good investment. These findings should give good reasons for graduate schools to consider developing a supportive, motivating environment, which identifies elements that are important to retention, and develop a suite of formal support mechanisms, including activities to address academic and holistic competencies. The expectation is that graduate deans can apply the findings discussed in Sowell et al. (2015) to the individual campus contexts where they can address overt and covert issues with faculty, deans, and other decision makers. They should also consider interventions that exist and are working, those that exist but are not working, and those that might need to be developed.
Directions for future studies
The findings and results of Completion and Attrition in AGEP and non-AGEP Institutions summarized in Sowell et al. (2015) have informed both scholarship and practice on the doctoral experience and outcomes of URM in several ways. Sowell et al. (2015) addresses a critical gap in doctoral education research related to attrition, particularly for historically marginalized groups. Importantly, statistical trends illuminate significant systemic disparities among students who finish doctoral study and those who don’t within STEM fields. Sowell et al. (2015) has also advanced general concepts related to attrition in doctoral education research (i.e., lack of financial support, isolation, lack of academic support) (Gardener, 2009; Lovitts, 2001; Lott, Gardener and Powers, 2011; McAlpine and Norton, 2006).
There continues to be tremendous opportunity to further explore and examine STEM student experiences regarding the pathway toward doctoral study, including: the role of institutions and understanding students’ academic progress and decision-making at the undergraduate level (Lundy-Wagner, Gasman, and Vultaggio, 2013; McGhee and Martin, 2011); exploring student perspectives of institutional environments and academic success support systems while engaged in doctoral study (Le and Gardner, 2011), and the ways students prepare for post-degree completion into their disciplines/professions (Thiry, Laursen, and Loshbaugh, 2015).
Also, in more technical aspects, data collection efforts could be augmented to facilitate deeper qualitative inquiry of student and/or doctoral degree completers’ perspectives to understand the ways in which efforts to support doctoral student experiences are perceived by students and multiple stakeholders involved with the doctoral process. Future studies with case study, phenomenology, ethnography, or narrative research designs would provide deeper and more meaningful analysis of how students manage barriers to degree completion and the ways they specifically avoid academic pitfalls leading to attrition.
Further inquiry should emphasize the experiences of historically marginalized students and academic/organizational systems supporting degree completion through transformative approaches to academic success, through academic advisement and mentorship, gendered, racial, cultural processes, and personal and programmatic efforts supporting socialization, (Barker, 2011; Bertrand Jones, Wilder & Osbourne-Lampkin, 2013; Blockett, Felder, Collier & Parrish, 2015; Felder, Gasman, & Stevenson, 2014; Gasman, Anderson-Thompkins & Haydel, 2006; Gasman, Gerstl-Pepin, Anderson-Thompkins, Rasheed & Hathaway, 2004; Gildersleeve & Croom, 2011; Gonzalez, 2006; Baker, Pifer & Griffin, 2014;Harper & Hurtado, 2007; Hurtado, Clayton-Pederson, Allen & Milem, 1998; Hurtado & Ruiz, 2012; McCallum, 2015; Morrison, Rudd, & Nerad, 2011; Patton, 2009; Tierney, 1997; Weidman, Twale & Stein, 2001).
Concluding remarks
As our nation’s higher education system continues to address the effects of changing demographics and the intellectual, cultural, and technological demands of its constituents, conducting research focused on the processes of completion, both generally and by discipline, is critical to supporting doctoral students toward strengthening our national capacity. Sowell et al. (2015) fills a critical gap in understanding of completion and attrition of URM students in STEM doctoral programs. In addition to its contribution to the scholarship, the report and the data collected through this project serve as an important benchmarking tool for U.S. graduate schools. There is still considerable work to be done to narrow the attainment gap of URM students in these fields, particularly in doctoral programs, but Sowell et al. (2015) furthers the discussion by presenting robust data that can be benefited by both campus leaders and policy makers.
Note
This paper is based upon work partially supported by the National Science Foundation under Grant No. 1138814. Any opinions, findings, and conclusions or recommendations expressed in this paper are those of the authors and do not necessarily reflect the views of the National Science Foundation.
Suggested Citation: Okahana, H., Allum, J., Felder, P.P., & Tull, R.G. (2016). Implications for practice and research from Doctoral Initiative on Minority Attrition and Completion (CGS Data Sources PLUS #16-01). Washington, DC: Council of Graduate Schools.
About the authors:
Hironao Okahana is Director, Statistical Analysis and Policy Research, Council of Graduate Schools.
Jeff Allum is Assistant Vice President, Research and Policy Analysis, Council of Graduate Schools.
Pamela P. Felder is Associate Professor of Organizational Leadership, University of Maryland, Eastern Shore.
Renetta G. Tull is Associate Vice Provost for Graduate Student Development and Postdoctoral Affairs, University of Maryland, Baltimore County.
Notes:
1. For the purpose of this paper, the term “underrepresented minority” refers to persons identify themselves as U.S. citizens and permanent residents who are Black/African American, Hispanic/Latino, American Indian/Alaska Native, or Native Hawaiian/Pacific Islander.
2. Council of Graduate Schools, student-level data from the Completion and Attrition in AGEP and non-AGEP Institutions (NSF grant #1138814)” project, unpublished additional analysis by Okahana, H. and Allum, J.
3. The figure adopted from 10-year Doctoral Completion Rates of URM STEM Students by Selected Characteristics. Reprinted from Doctoral experience and outcomes of URM students in STEM fields: Implications for future assessment and practice (Slide 7), by H. Okahana & J. Allum, 2015, a presentation for the CGS Spring 2015 Research and Policy Forum, 2015, May.
4. National Science Foundation, the 2013 National Survey of College Graduates data, computation by the authors.
5. The figure adopted from Table 4.2 URM Graduate Student Experience by Candidacy Status. Reprinted from Doctoral Initiative on Minority Attrition and Completion (p.42), by R. Sowell, J. Allum, & H. Okahana, 2015, Washington, DC: Council of Graduate Schools. Copyright 2015 by the Council of Graduate Schools.
References
Allum, J., & Okahana, H. (2015). Graduate enrollment and degrees: 2004 to 2014. Washington, DC: Council of Graduate Schools.
Baker, V.L., Pifer, M.J., Griffin, K.A. (2014). Mentor-protégé fit: Identifying and developing effective mentorship across identities in doctoral education, International Journal for Researcher Development, (5)2, 83-98.
Barker, M. (2011). Racial context, currency, and connections: Black doctoral student and white faculty advisor perspectives on cross-race advising. Innovative Education & Teaching International. 48(4), 387-400.
Bertrand Jones, T., Wilder, J. A., & Osborne-Lampkin, L. (2013). Employing a Black feminist approach to doctoral advising: Preparing Black women for the professoriate. Journal of Negro Education, 82(3), 326-338.
Blockett, R., Felder, P.P., Collier, J., Parrish, W. (2015). Pathways to the professoriate: Exploring African-American doctoral student socialization and the pipeline to the academic profession, Paper presented at the American Educational Research Association Annual Meeting, Chicago, IL.
College Board (2010). The educational crisis facing young men of color: Reflections on four days of dialogue on the educational challenges of minority males. Retrieved from https://professionals.collegeboard.com/profdownload/educational-crisis-facing-young-men-of-color.pdf.
Council of Graduate Schools and Educational Testing Service. (2010). The path forward: The future of graduate education in the United States. Report from the Commission on the Future of Graduate Education in the United States. Princeton, NJ: Educational Testing Service.
Council of Graduate Schools and Educational Testing Service. (2012).Pathways through graduate school and into careers. Report from the Commission on Pathways Through Graduate School and Into Careers. Princeton, NJ: Educational Testing Service.
Edwards Lange, S. (2010). The master’s degree: A critical transition in STEM doctoral education. Presentation at the CGS/NSF Workshop, Arlington, VA.
Felder, P. P., Stevenson, H. C., & Gasman, M. (2014). Understanding race in doctoral student socialization. International Journal of Doctoral Studies, 9, 21-42.
Harper, S.R. (2006). Black male students at public flagship universities in the US: Status, trends, and implications for policy and practice. Washington, DC: Joint Center for Political and Economic Studies Health Policy Institute.
Gasman, M., Anderson-Thompkins, S., & Haydel, N. (2006). Corridors and coffee shops: Teaching about race and research outside the classroom. Journal of College and University Teaching, 17 (1&2).
Gasman, M., Gerstl-Pepin, C., Anderson-Thompkins, S., Rasheed, L., & Hathaway, K. (2004). Developing trust, negotiating power: transgressing race and status in the academy. Teachers College Record, 106(4), 689-715.
Gardner, S. K. (2009). Student and faculty attributions of attrition in high and low-completing U.S. doctoral programs. Higher Education, 58, 97-112.
González, J. C. (2006). Academic socialization experiences of Latina doctoral students A qualitative understanding of support systems that aid and challenges that hinder the process. Journal of Hispanic Higher Education, 5(4), 347-365.
Gumport, P.J. (2011). Graduate education and research: Axes of interdependence and strain. In P. Altbach, R. Berdahl, and P.J. Gumport (eds.) American higher education in the 21st Century: Social, political, and economic challenges. 3rd edition. Baltimore, MD: Johns Hopkins University Press.
Harper, S. R., & Hurtado, S. (2007). Nine themes in campus racial climates and implications for institutional transformation. In S. R. Harper, & L. D. Patton (Eds.), Responding to the realities of race on campus. New Directions for Student Services (No. 120, pp. 7-24). San Francisco: Jossey-Bass.
Hurtado, S., Clayton-Pedersen, C., Milem, J. & Allen, W. (1999). Enacting diverse learning environments. ASHE-ERIC Higher Education Report, 26(8), 1–140
Hurtado, S., & Ruiz, A. (2012). The climate for underrepresented groups and diversity on campus: HERI Research Brief. Higher Education Research Institute at UCLA.
Le, T., & Gardner, S. K. (2010). Understanding the doctoral experience of Asian international students in the STEM fields: An exploration of one institutional context. Journal of College Student Development, 51, 252-264
Lee, J.M., & Ransom, T. (2011). The education experience of young men of color: A review of research, pathways, and progress. Retrieved from https://youngmenofcolor.collegeboard.org/sites/default/files/downloads/EEYMC-ResearchReport.pdf.
Lott, J. L., Gardner, S., & Powers, D. A. (2009). Doctoral student attrition in the STEM fields: An exploratory event history analysis. Journal of College Student Retention: Research, Theory & Practice, 11(2), 247-266.
Lovitts, B. (2001). Leaving the ivory tower: The causes and consequences of departure from doctoral study. Lanham, MD: Rowman and Littlefield.
McAlpine, L., & Norton, J. (2006). Reframing our approach to doctoral programs: an integrative framework for action and research. Higher Education Research & Development, 25(1), 3-17.
McCallum, C.M. (2015). ‘Mom made me do it’: The role of family In African Americans’ decisions to enroll in doctoral education. Journal of Diversity and Higher Education, 2(8), 1-14
McGee, E. O., & Martin, D. B. (2011). ‘‘You would not believe what I have to go through to prove my intellectual value!’’: Stereotype management among academically successful Black mathematics and engineering students. American Education Research Journal, 48(6), 1347-1389
Morrison, E., Rudd, E, Nerad, M. 2011. Onto, Up, Off the Academic Faculty Ladder: The Gendered Effects of Family on Career Transitions for a Cohort of Social Science PhDs. The Review of Higher Education. 34(4), 525-553.
National Science Board (2015). Science and engineering indicators 2014. Arlington, VA: National Science Foundation.
National Science Foundation, National Center for Science and Engineering Statistics. (2015). Doctorate Recipients from U.S. Universities: 2014. Special Report NSF 16-300. Arlington, VA. Available at http://www.nsf.gov/statistics/2016/nsf16300/.
Patton, L. D. (2009). My sister’s keeper: A qualitative examination of mentoring experiences among African American women in graduate and professional schools. Journal of Higher Education, 80(5), 510–537.
Sowell, R., Allum, J., & Okahana, H. (2015). Doctoral initiative on minority attrition and completion. Washington, DC: Council of Graduate Schools.
Sowell, R.S., Bell, N., Francis, S., Goodwin, L. (2010). The role and status of the master’s degree in STEM. Washington, DC: Council of Graduate Schools.
Sowell, R.S., Zhang, T., Bell, N., & Redd, K. (2008). Ph.D. completion and attrition: Analysis of baseline demographic data from the Ph.D. Completion Project. Washington, DC: Council of Graduate Schools.
Thiry, H., Laursen, S. L., & Loshbaugh, H. G. (2015). “How do I get from here to there?” An examination of Ph.D. science students’ career preparation and decision-making. International Journal of Doctoral Studies, 10, 237- 256.
Tierney, W. G. (1997). Organizational socialization in higher education. The Journal of Higher Education, 68, 1-16.
Weidman, J. C., Twale, D. J., & Stein, E. L. (2001). Socialization of graduate and professional students in higher education: A perilous passage? San Francisco, CA: Jossey-Bass.
Walker, G.M., Golde, C.M., Jones, L, Conklin Bueschel, A., and Hutchings, P. (2008). The formation of scholars: Rethinking doctoral education for the twenty-first century. The Carnegie Foundation for the Advancement of Teaching. San Francisco: Jossey Bass.
The CGS/GRE Survey of Graduate Enrollment and Degrees collects data on graduate applications received, graduate applications accepted, and first-time graduate enrollment. When combined, these data could be used to estimate both selectivity and yield, but CGS’ annual reports have not traditionally performed such calculations. Using data on the number of graduate applications accepted and the number of graduate students enrolled for the first-time for all years between Fall 2010 and Fall 2014, CGS estimated yield rates at the master’s/certificate level (including graduate certificate and education specialist programs) and doctoral level. In fact, data from the survey estimate that among all prospective master’s/certificate students whose applications to public institutions with very high research activity (RU/VH) were accepted, 55% actually enrolled in Fall 2014. By comparison, 42% of prospective doctoral students whose applications were accepted by public RU/VH institutions enrolled in Fall 2014.
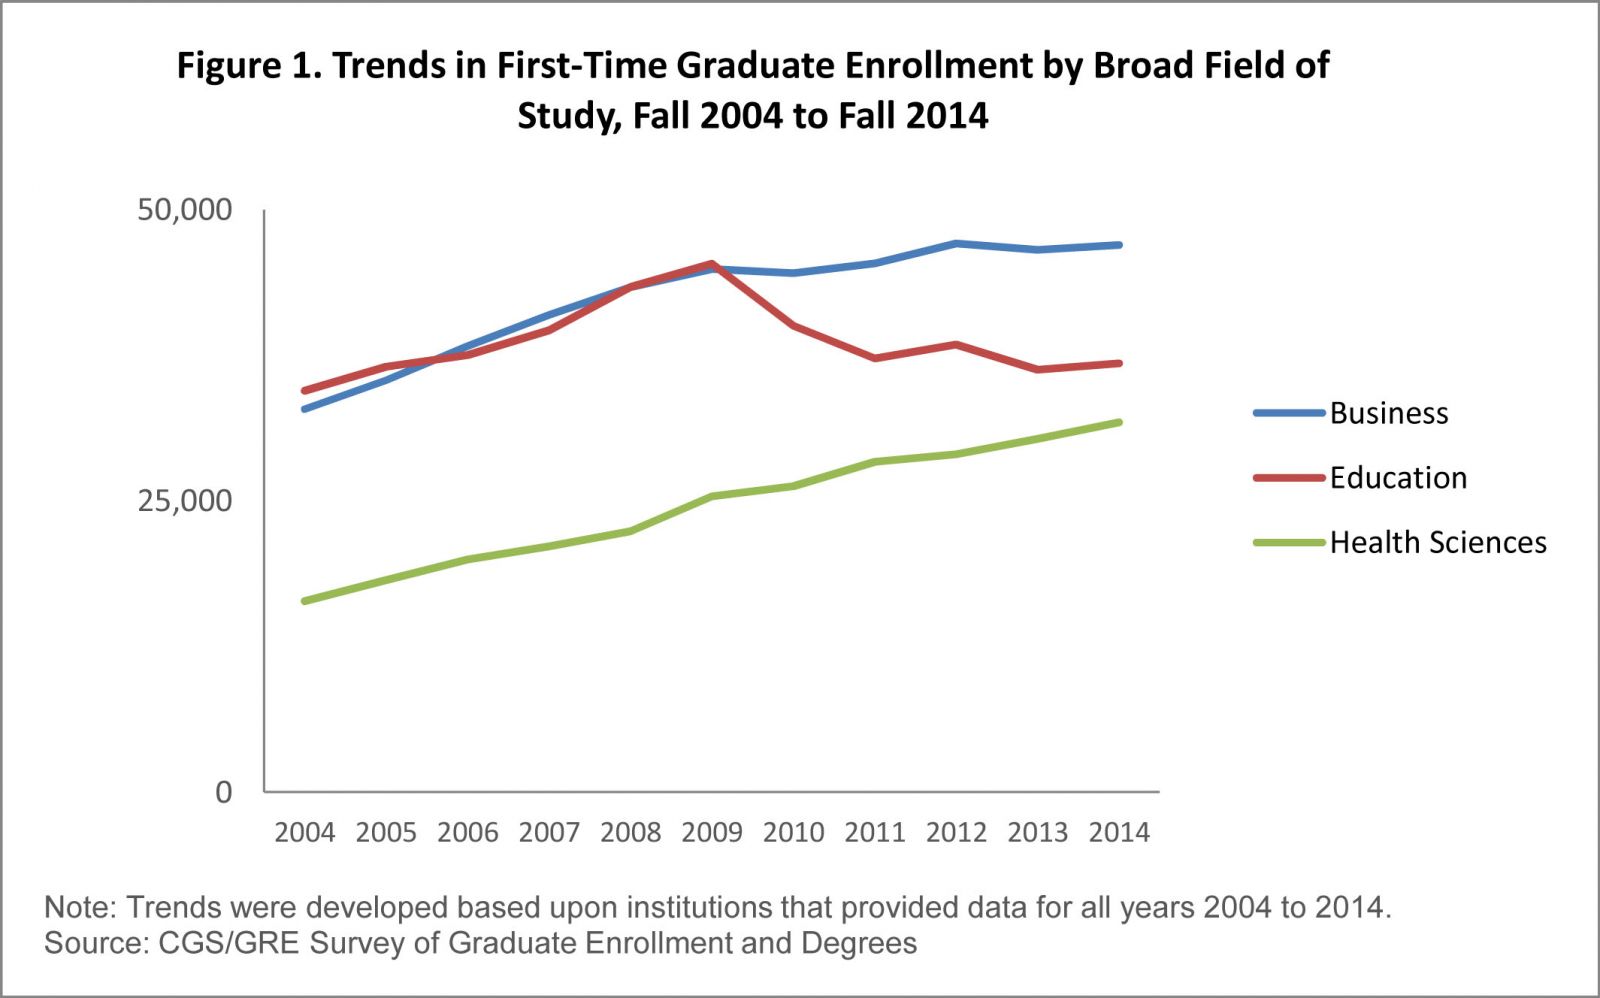
Although the survey collects data for 50 disciplines (e.g., Chemistry, English, Religion, & Theology, etc.), this article focuses on disciplines within three of the largest broad fields of study (business, education, health and medical sciences). These three fields of study account for 43% of all graduate applications received in Fall 2014 and 48% of all first-time graduate enrollment in Fall 2014. Moreover, these three broad fields of study exhibited somewhat different first-time graduate enrollment patterns in the years immediately following the Great Recession (Allum & Okahana, 2015). While first-time graduate enrollment in the broad field of education declined dramatically, first-time graduate enrollment in business continued to grow (although at a slower rate), while analysis suggest several differences in yield accordingly. Education featured prominently among the highest yield rates of 2014 at both the master’s/certificate and doctoral levels. Seven different education fields (administration; curriculum & instruction; educational evaluation and research; education, other; elementary education; secondary education; and special education) were featured in the 15 highest master’s/ certificate yields of 2014 (see Table 1).
%2C%202010%20to%202014.jpg)
Among the three business disciplines, the yield in accounting (65%) was among the highest among master’s/certificate programs in Fall 2014, while business administration & management, by far the largest master’s/ certificate discipline within the broad field of business, reported a yield of 58%, slightly higher than the overall master’s/certificate yield of 55%. The 55% yield in health and medical sciences master’s/certificate programs for Fall 2014 was roughly in the middle one- third of all yields, and exactly the same as the 55% average across all 50 disciplines.
When examining the percent changes in yield between Fall 2010 and Fall 2014 at the master’s/certificate level, elementary education was the only education discipline to report the largest decrease in yield, an eight percentage point decline, from 65% in Fall 2010 to 57% in Fall 2014. However, six education master’s/certificate disciplines reported among some of the largest increases in yield among all fields. For example, the yield in education administration increased nine percentage points between Fall 2010 (52%) and Fall 2014 (61%). Despite only having a 5% increase in yield from Fall 2010 to Fall 2014, banking and finance was among the disciplines with the highest increase in yield at the master’s/certificate level. Finally, there was a six percentage point decrease in yield between Fall 2010 and Fall 2014 in health and medical science master’s/certificate programs (from 61% in Fall 2010 to 55% in Fall 2014).
Doctoral Yields
There were some noteworthy patterns at the doctoral level as well. Three education fields (curriculum & instruction; education, other; and educational evaluation and research) were among the doctoral programs with highest yields in 2014, ranging from 66% for curriculum and instruction to 56% for education, other (see Table 2). With a 61% yield, business administration & management was among the top three disciplines in terms of yield at the doctoral level. At 56%, the yield for doctoral programs in health and medical sciences was among the top six, and 14 percentage points higher than the 42% first-time graduate enrollment in health and medical sciences increased at a steady rate (see Figure 1).
%2C%202010%20to%202014.jpg)
Master’s/Certificate Yields
Among the three broad fields of study, the number of graduate students enrolled for the first-time in master’s/certificate programs during Fall 2014 (39,503) outnumbered the number of students enrolled for the first-time in doctoral programs (6,421) by a margin of more than six to one, and data from this average yield across all 50 disciplines.
There were also some noteworthy patterns in yields between Fall 2010 and Fall 2014 at the doctoral level. Education administration saw an increase in yield of 15% between Fall 2010 and Fall 2014. This was the fifth largest increase in yield among all doctoral disciplines. Banking and finance had a 23% increase in yield from Fall 2010 to Fall 2014, which was third highest among all doctoral programs. Among health and medical sciences, there was a six percent increase in yield between Fall 2010 and Fall 2014, from 49% to 56%.
Summary
This first glance at yields sheds light on some of the noteworthy variations by discipline and degree objective among public universities with very high research activity (RU/VH), and it is reasonable to expect that variations in yield among other groups of institutions exist as well. While many of us within the graduate enterprise might wonder about correlations between yield, selectivity, enrollment, and completion, it is worth noting that some of these data may already exist and, if put to use in the right way, might continue to advance graduate education.
By Jeff Allum, Assistant Vice President, Research and Policy Analysis and Kenneth Polishchuk, Best Practices Associate, Council of Graduate Schools
References
Allum J., & Okahana, H. (2015). Graduate enrollment and degrees: 2004-2014.Washington, D.C.: Council of Graduate Schools.
Data Sources PLUS: Supporting Students of Color on the Pathway to Graduate Education
December 2016
This paper summarizes the proceedings of the spring 2016 CGS Research and Policy Forum, where Dr. Linda DeAngelo, assistant professor of higher education at the University of Pittsburgh spoke about the roles of faculty mentorship in facilitating graduate school aspirations of students of color. Implications for institutional culture around mentorship are discussed.
October 2016
The recently released Graduate Enrollment and Degrees: 2005 to 2015 (Okahana, Feaster, & Allum, 2016) report provides a comprehensive look at master’s and research doctoral enrollment in the United States. The results from the survey are portrayed in the report in a variety of ways, including breakdowns by student and institutional characteristics. Since the college football season has recently started, this article compares applications, offers of admission, and first-time graduate enrollment by NCAA Division I-A football conferences. There are currently nine NCAA Division I-A conferences containing at least five CGS member institutions. Two Division I-A conferences, Conference USA and FBS Independents, did not have five responding institutions and were therefore not included in this analysis.
July 2016
Graduate programs at U.S. institutions continue to enjoy robust enrollment growth among international students pursuing both master’s and doctoral degrees according to the 2015 Council of Graduate Schools (CGS) International Graduate Admissions Survey. This brief explores the 2015 CGS International Graduate Admissions Survey for the first-time international graduate student enrollment in master’s/certificate programs by U.S. regions and states and highlights key findings.
Data Sources: Highlights from the 2016 CGS Pressing Issues Survey
April 2016
In February of 2016, the Council of Graduate Schools (CGS) launched its annual Pressing Issues Survey which asked graduate deans at member institutions to identify the three most important or “pressing” issues or challenges they currently face. The findings from this survey not only inform the graduate community about the concerns of graduate deans, but also help shape sessions at the CGS Summer Workshop and Annual Meeting. These insights provide impetus for new CGS best practices projects and research initiatives.
Data Sources: Key Takeaways from the 2014 Survey of Earned Doctorates
March 2016
As researchers, entrepreneurs, inventors, and more, graduate students and graduate degree holders contribute to the resolution of complex social problems and advancement of our society. Thus, a robust growth of graduate education and the number of advanced degree holders in our nation’s labor force is essential to economic prosperity and continued global leadership of the United States. The most recent Survey of Earned Doctorates (SED:14), an annual census of research doctorate recipients conducted by the National Science Foundation (NSF), reported that a total of 54,070 individuals earned a research doctorate at 426 US academic institutions between July 1, 2013 and June 30, 2014. This represents both the highest number in the survey’s history since 1957 and positive growth of earned doctorates for the fourth year in a row. Detailed characteristics of the doctoral recipients can be found in the recently released NSF report on SED:14, “Doctorate Recipients from US Universities: 2014,”and this article summarizes some key takeaways for graduate deans.
This paper summarizes the proceedings of the spring 2015 CGS Research and Policy Forum, where findings and implications of a CGS publication, Doctoral Initiative on Minority Attrition and Completion were discussed. As a benchmarking tool, the publication serves as one of the most robust resources available to U.S. graduate schools to describe URM STEM doctoral completion, and it also helps institutions make a case for continuing programing that are aimed to facilitate success of URM STEM doctoral students.
Data Sources: A Glimpse at Yield Rates at Public RU/VH Institutions
February 2016
The CGS/GRE Survey of Graduate Enrollment and Degrees collects data on graduate applications received, graduate applications accepted, and first-time graduate enrollment. When combined, these data could be used to estimate both selectivity and yield, but CGS’ annual reports have not traditionally performed such calculations.
Humanities Indicators
November 30, 2016
The Humanities Indicators Project is a project of the American Academy of Arts & Sciences that provides the latest data on humanities trends in five broad areas: K-12 education, higher education, workforce, funding & research, and public life. Occupations and earnings data of humanities PhD and master’s degree recipients, in relation and comparison to those of select other broad fields of study, were discussed in this forum.
Highlights from the 2015 CGS/GRE Survey of Graduate Enrollment & Degrees
August 30, 2016
The 2015 CGS/GRE Survey of Graduate Enrollment & Degrees provides data about applications for admission to graduate school and graduate student enrollment in Fall 2015, and graduate degrees and certificates conferred in 2014-15. The survey has been jointly conducted by CGS and the Graduate Record Examinations (GRE) Board since 1986 and annually offers one of the most comprehensive examinations of trends in graduate enrollment and degrees in the United States
Supporting Students of Color on the Pathway to Graduate Education: Barriers and Supports on Mentoring
May 18, 2016
Faculty mentorship plays a critical role in facilitating graduate school aspirations among undergraduate students, particularly for students from traditional underrepresented minority backgrounds. This presentation defines what constitutes mentoring and how faculty members may be motivated to engage in mentoring activities. It also discusses some of the barriers against institutional environment and disciplinary culture that encourage and promote mentoring behavior among faculty.
Science & Engineering Indicators
March 17, 2016
The Science & Engineering Indicators report is one of the preeminent sources of information on education, labor market, and demographic characteristics of the science and engineering enterprise. The 2016 version, released earlier this year, contains not only a wealth of data, but is being delivered in an almost entirely electronic mode. Trends in graduate education and the academic labor market are the particular topics of focus for this presentation.
The following reports summarize the findings of the CGS International Graduate Admissions Survey:
| 2020 | Applications, Admissions, & Enrollment | Figures & Tables | Report | Press Release |
| 2019 | Applications, Admissions, & Enrollment | Figures & Tables | Report | Press Release |
| 2018 |
Applications, Admissions, & Enrollment |
Report | Press Release | |
| 2017 |
Applications, Admissions, & Enrollment |
Report | Press Release | |
| 2016 |
Preliminary Applications |
Notes and Definitions | Data Tables | Infographic |
| Applications, Admissions, & Enrollment | Questionnaire | Report | Press Release | |
| 2015 | Preliminary Applications | Methodology and Questionnaire | Report | Press Release |
| Applications, Admissions, & Enrollment | Questionnaire | Report |
Press Release |
|
| 2014 |
Applications |
Questionnaire | Report | Press Release |
|
Admissions |
Questionnaire | Report | Press Release | |
|
Enrollment |
Questionnaire | Report | Press Release | |
| 2013 |
Applications |
Questionnaire | Report | Press Release |
|
Admissions |
Questionnaire | Report | Press Release | |
|
Enrollment |
Questionnaire | Report | Press Release | |
|
2012 |
Applications |
Questionnaire | ||
|
Admissions |
Questionnaire | |||
|
Enrollment |
Questionnaire | |||
|
2011 |
Applications |
Questionnaire | ||
|
Admissions |
Questionnaire | |||
|
Enrollment |
Questionnaire | |||
|
2010 |
Applications |
Questionnaire | ||
|
Admissions |
Questionnaire | |||
|
Enrollment |
Questionnaire | |||
|
2009 |
Applications |
Questionnaire | ||
|
Admissions |
Questionnaire | |||
|
Enrollment |
Questionnaire | |||
|
2008 |
Applications |
Questionnaire | ||
|
Admissions |
Questionnaire | |||
|
Enrollment |
Questionnaire | |||
|
2007 |
Applications |
Questionnaire | ||
|
Admissions |
Questionnaire | |||
|
Enrollment |
Questionnaire |
77% of First-Time Graduate Students Are Enrolled in Master’s or Certificate Programs
Contact: Julia Kent
(202) 223-3791 / jkent@cgs.nche.edu
Washington, DC —New data from the Council of Graduate Schools (CGS) provide an unprecedented picture of the degree objectives of international graduate students studying in the United States. As the only report of its kind to offer data on the current fall term, International Graduate Applications and Enrollment: Fall 2015 reports applications, admissions, and enrollments of international master’s, certificate, and doctoral students at U.S. colleges and universities.
Based on an annual survey of graduate institutions, the data show that the degree objectives of international applicants and enrollees vary widely by country of origin and field of study. Overall, however, nearly four out of five first-time enrollees are pursuing master’s or certificate programs. This finding contradicts a common assumption—that many if not most international graduate students come to the U.S. to pursue doctoral degrees.
Chinese and Indian students represented the largest share of first-time master’s and certificate enrollment for Fall 2015, together representing more than 7 out of 10 first-time enrollees in these programs. Indian students, for whom first-time enrollment has seen double-digit increases over the past three admission cycles, demonstrated the strongest interest, with nine out of every ten first-time graduate students enrolling in master’s degrees and certificates this fall semester.
By contrast, certain countries and regions demonstrated particularly strong first-time enrollment in doctoral programs: 47% of South Korean students, and 44% of students from the Middle East and North Africa enrolled in doctoral programs in Fall 2015. These groups not only diverge from the preferences of their peers of other nationalities, but also with trends in overall doctoral enrollment at U.S. institutions. According to the CGS/GRE Survey of Graduate Enrollment and Degrees, which captured data from the previous year (2014), first-time doctoral enrollment for both international and domestic students constituted only 16.8% of all graduate enrollment.
CGS President Suzanne T. Ortega observed that the report’s findings demonstrate the strong reputation of U.S. master’s degrees outside the United States. “While doctoral programs and institutions have long been viewed as a major draw from international students, it is clear that international students also recognize the value of U.S. master’s education.” She added, “Master’s degrees are critical entry points for a wide variety of professions. International students are taking advantage of the skills and knowledge these programs offer in addition to the stellar doctoral training provided by U.S. institutions.”
Additional report findings can be found in the attached page of highlights and infographics.
About the survey and report
Conducted since 2004, the CGS International Graduate Admissions Survey tracks the applications and enrollments of international students seeking U.S. master’s and doctoral degrees. For the first time in 2015, institutions responding to the survey were asked to disaggregate their data for master’s and certificate programs and doctoral programs, yielding the only degree-level data currently available for graduate admissions and enrollments. Three hundred fifty U.S. graduate institutions who are members of CGS or its regional affiliates responded the 2015 survey.
The Council of Graduate Schools (CGS) is an organization of approximately 500 institutions of higher education in the United States and Canada engaged in graduate education, research, and the preparation of candidates for advanced degrees. The organization’s mission is to improve and advance graduate education, which it accomplishes through advocacy in the federal policy arena, research, and the development and dissemination of best practices.
International Students Continue to Drive Growth
Contact:
Julia Kent, CGS: (202) 223-3791 / jkent@cgs.nche.edu
Washington, DC — The Council of Graduate Schools (CGS) today reported a 3.5% one-year increase in first-time graduate enrollment between Fall 2013 and Fall 2014—the largest since 2009. Institutions responding to the CGE/GRE Survey of Graduate Enrollment & Degrees received more than 2.1 million applications for Fall 2014, extended over 850,000 offers of admission in Fall 2014, and enrolled nearly 480,000 incoming, first-time graduate students in fall 2014 graduate certificate, education specialist, master’s or doctoral programs—all new highs.
CGS President Suzanne T. Ortega emphasized that enrollment growth is critical to meeting the needs of the U.S. economy. “The increase in overall enrollments is good news, but the disparity between U.S. and international growth is a cause for concern.”
Ortega pointed to data from the Bureau of Labor Statistics projecting employers to add nearly 2.4 million jobs requiring a graduate degree or higher between 2012 and 2022. At this rate, Ortega said, additional master’s and doctoral degree holders are needed to make that projected result possible. “Greater investments in graduate education and research—supporting both domestic and international students—will be required to keep up with the demand for graduate level talent in the future,” Ortega said.
The contributions of international graduate students are becoming increasingly important to the U.S. graduate education enterprise. From 2004 to 2014, international students accounted for over two-thirds of the growth in first-time enrollment headcounts at U.S. graduate institutions. Furthermore, international students are more likely than their domestic counterparts to study in STEM fields. In Fall 2014, 65.9% of all temporary resident graduate students were enrolled in biological and agricultural sciences, engineering, mathematics and computer sciences, physical and earth sciences, or social and behavioral sciences. In contrast, only 27.1% of U.S. citizen/permanent resident graduate students were enrolled in these fields.
Other report findings include:
Findings by field
Findings by degree level
Student demographics
About the report
Graduate Enrollment and Degrees: 2004 to 2014 presents the findings of an annual survey of U.S. graduate schools, co-sponsored by CGS and the Graduate Record Examinations (GRE) Board. It is the only annual national survey that collects data on graduate enrollment by all fields of study and is the only source of national data on graduate applications by broad field of study. The report, which includes responses from 636 institutions, presents statistics on graduate applications and enrollment for fall 2014, degrees conferred in 2013-14, and trend data for one-, five- and ten-year periods.
The Council of Graduate Schools (CGS) is an organization of over 500 institutions of higher education in the United States and Canada engaged in graduate education, research, and the preparation of candidates for advanced degrees. The organization’s mission is to improve and advance graduate education, which it accomplishes through advocacy in the federal policy arena, research, and the development and dissemination of best practices.
November 2014
First-time enrollment of international students at U.S. graduate institutions has grown for the fifth consecutive year. Between 2013 and 2014, first-time enrollment of international graduate students increased by 8%, while total graduate enrollment also increased by 8%.
CGS/GRE Graduate Enrollment and Degrees: 2003 to 2013
September 2014
The CGS/GRE Survey of Graduate Enrollment and Degrees has reported a 1.0% increase in first-time enrollment between fall 2012 and fall 2013. More than 459,000 students enrolled for the first time in graduate certificate, education specialist, master’s, or doctoral programs for the fall 2013 term.
August 2014
According to the Phase II report of the 2014 CGS International Graduate Admission Survey, initial offers of admission from U.S. graduate schools to prospective international students increased 9% from 2013 to 2014. The new data marks the fourth consecutive year of 9% growth in offers of admission to prospective international graduate students.
2014 CGS International Graduate Admissions Survey, Phase I: Applications
April 2014
The preliminary number of applications from prospective international students to U.S. graduate schools increased 7% in 2014, up from the 2% increase seen in 2013. This year’s encouraging increase is more consistent with the growth trend in international graduate applications seen between 2006 and 2012, after a post-9/11 decrease.
Enrollment and Degrees in Professional Science Master's Programs: 2013
January 2014
PSM programs stand out as a bright spot for U.S. institutions in terms of domestic enrollment trends. From 2010 to 2013, first-time enrollment of domestic students rose 19% in PSM programs. For U.S. graduate education as a whole, first-time enrollment of domestic students rose only 1.9% in the five year period between 2007 and 2012, according to the latest CGS/GRE Graduate Enrollment and Degrees report. In contrast, first-time enrollment of international graduate students rose markedly from 2010 to 2013 in both PSM programs and in U.S. graduate programs overall.
November 2013
The 2013 Phase III report of the CGS International Graduate Admissions Survey found a 10% increase in the first-time enrollment of international graduate students from 2012 to 2013, a growth that adds to 8% increases in this figure in each of the last two years. Total enrollment of international graduate students among responding institutions reached 220,000 in 2013.
Outcomes for Professional Science Master's Alumni: 2012/13
October 2013
Recent graduates of Professional Science Master’s (PSM) degree programs are reporting strong rates of employment and high income levels, according to the results of the third annual PSM Student Outcomes Surveyreleased by the Council of Graduate Schools (CGS). The report tracks initial hiring trends and perceived satisfaction among graduates of PSM degree programs between 2010 and 2013. The study was supported with funding from the Sloan Foundation.
CGS/GRE Graduate Enrollment and Degrees: 2002 to 2012
September 2013
The Council of Graduate Schools (CGS) reported a 1.8% increase in first-time enrollment between fall 2011 and fall 2012. More than 461,000 students enrolled for the first time in graduate certificate, education specialist, master’s, or doctoral programs for the fall 2012, according to institutions responding to the CGS/GRE Survey of Graduate Enrollment and Degrees, an annual survey that has been conducted since 1986.
August 2013
The 2013 Phase II report of the CGS International Graduate Admissions Survey has found that initial offers of admission from U.S. graduate schools to prospective international students increased 9% from 2012 to 2013, following an increase of 9% last year. The new data marks the fourth consecutive year of growth in international graduate admissions.
2013 CGS International Graduate Admissions Survey, Phase I: Applications
April 2013
According to the 2013 Phase I report of the CGS International Graduate Admissions Survey, the number of applications from prospective international students to U.S. graduate schools increased a mere 1% in 2013, following a 9% gain in 2012 and an 11% increase in 2011.
Enrollment and Degrees in Professional Science Master's Programs: 2011/12
February 2013
According to the Council of Graduate Schools' third annual report on enrollment and degrees in Professional Science Master's programs, total enrollment increased by 22% between 2010 and 2012.
International Applications Up 2% for Fall 2015
Contact:
Julia Kent
jkent@cgs.nche.edu
(202) 223-3791
Washington, DC—New data from the Council of Graduate Schools (CGS) provides a first-ever breakdown of international graduate applications by degree objective. The report, 2015 CGS International Graduate Admissions Survey: Preliminary Applications, collects data on international graduate applications by all geographic regions and fields of study, revealing trends important to the graduate research enterprise and our understanding of the global competition for top talent. Conducted annually since 2004, the survey was expanded this year to distinguish between applications to programs at the doctorate and master’s & certificate levels.
The findings show that degree objectives of international applicants vary dramatically by country of origin and field of study, and in some cases contrast with those of their domestic U.S. counterparts.
No sending country favored master’s studies more than India, where 84% of graduate applications were for admission to master’s & certificate programs. The master’s share of graduate applications was also large among students from China (64%) Saudi Arabia (60%), and Taiwan (52%). Smaller shares of graduate applications went to master’s programs from prospective international graduate students from Mexico (50%), Canada (45%), Brazil (43%), Europe (35%), and South Korea (30%).
Overall, international students applied to doctoral programs in higher proportion than their domestic U.S. counterparts. Thirty-seven percent of international graduate enrollments were in PhD programs, compared to only 17 percent among U.S. citizens and permanent residents, according to the CGS/GRE Survey of Graduate Enrollment and Degrees.
According to CGS President Suzanne T. Ortega, the additional data on degree objectives is illuminating for U.S. graduate schools, even as it leads to more questions about the goals and motivations of international graduate students. “Now that our international survey offers data by degree objective, we will have a more nuanced picture of the encouraging growth we have seen in international applications to U.S. graduate programs,” Ortega said. “Our challenge is to investigate what these new data can tell us about the market for advanced skills. Are students preparing for careers in the U.S. or at home after earning their degree? Are they drawn here by academic reputations, employment prospects, or professional advancement? How do economic conditions in the U.S. and abroad influence international graduate enrollments?”
Trends by country of origin
International graduate applications for Fall 2015 increased 2% from Fall 2014, for a total 676,484 applications received by the U.S. institutions responding to the survey. For the third consecutive year, applications from China were down (-2%) while applications from India posted double-digit growth (12%). China remains the largest source of prospective students for U.S. programs, representing 39% of all international graduate applications. India continues to narrow the gap between first- and second-largest source country, reaching 28% of international applications for Fall 2015. South Korea, the third-largest sending country, increased 4% after three straight years of declines.
.png)
Trends by field of study
Growth in applications was driven by engineering and physical & earth sciences, which gained 4% and 14%, respectively. Together these STEM (science, technology, engineering, and mathematics) fields account for 50% of all applications to U.S. graduate programs from prospective international students for Fall 2015. This makes international graduate students crucial to U.S. research and workforce needs. Experts (including CGS) have pointed out the American economy’s demand for advanced STEM skills is unlikely to be met by homegrown talent alone, as only 16% of U.S. citizens and permanent residents enrolled in graduate programs are studying in STEM fields, according to the CGS/GRE Survey of Graduate Enrollment and Degrees.
In another finding of the Preliminary Applications report, international applications to graduate programs in business fell 2%, the first decline in this field since the survey launched in 2004. Nevertheless, business was the third largest field of study, accounting for 13% of international graduate applications.
About the report
Findings from the 2015 CGS International Graduate Admissions Survey: Preliminary Applications are based on an annual survey of international graduate student applications among U.S. institutions. Some responding institutions may continue to receive international applications after the completion of the report. For this reason the figures are preliminary. Final application, admission and enrollment figures will be reported in late 2015. Final application numbers have traditionally tracked very closely to the preliminary numbers. Analysis from the 2015 Preliminary Applications report includes responses from 377 schools, including 80% of the top 100 institutions awarding the largest number of degrees to international graduate students. Collectively, the respondents to this year’s survey award about 70% of the degrees granted to international graduate students in the U.S. The full report is available at http://cgsnet.org/ckfinder/userfiles/files/Intl_I_2015_report_final.pdf.
The Council of Graduate Schools (CGS) is an organization of over 500 institutions of higher education in the United States and Canada engaged in graduate education, research, and the preparation of candidates for advanced degrees. Among U.S. institutions, CGS members award 91% of the doctoral degrees and 81% of the master’s degrees.* The organization’s mission is to improve and advance graduate education, which it accomplishes through advocacy in the federal policy arena, research, and the development and dissemination of best practices.
* Based on data from the 2013 CGS/GRE Survey of Graduate Enrollment and Degrees
![]()