

Thank you for visiting CGS! You are currently using CGS' legacy site, which is no longer supported. For up-to-date information, including publications purchasing and meeting information, please visit cgsnet.org.
Benchmarking

CGS is the leading source of information, data analysis, and trends in graduate education. Our benchmarking data help member institutions to assess performance in key areas, make informed decisions, and develop plans that are suited to their goals.
(Reprinted from the January/February 2012 issue of GradEdge)
For many students, the academic journey leading to a graduate degree starts with community college. These institutions provide access to higher education for students who in some cases may not yet even realize that a master’s degree or a doctorate is attainable. For other students, community colleges provide an affordable and/or a convenient means of earning college credit prior to enrolling, or even while enrolled, in a four-year institution.
In fall 2009, more than 7.5 million students were enrolled at two-year colleges in the United States (Snyder and Dillow, 2011). This figure reflects a rapid expansion in two-year college enrollment over the past decade, with an increase of more than one-third (34%) between 1999 and 2009. The majority (57%) of two-year college enrollees in fall 2009 were enrolled part-time.
Community colleges play an important role for students who are underrepresented in higher education. For example, two-year institutions enroll higher percentages of first generation college students than four-year institutions, as well as higher percentages of low socioeconomic status students and older students (Provasnik and Planty, 2008). These institutions also are important pathways to degree attainment for underrepresented minorities (African Americans, Hispanics, and Native Americans), since individuals from these racial/ethnic groups account for a higher percentage of the enrollees at two-year colleges than at four-year colleges. African Americans comprised 15% of the enrollees at two-year colleges in fall 2009, compared with 14% at four-year colleges. Hispanics comprised 17% of the enrollees at two-year colleges, compared with just 10% at four-year colleges, and Native Americans accounted for 1.2% of the enrollees at two-year colleges, compared with 0.9% at four-year colleges (Snyder and Dillow, 2011).
While two-year institutions serve higher percentages of underrepresented students, not all students attending these institutions do so with the intention of earning a degree. About 43% of two-year college attendees plan to complete an associate’s degree, and about 36% plan to transfer to a four-year institution (Provasnik and Planty, 2008). Many of the degree-seeking students, however, will fail to earn an associate’s degree or transfer to a four-year institution. The current degree completion rate at community colleges is just 28%, meaning that nearly three-quarters of all two-year college attendees fail to earn a certificate or a degree within 150% of the expected normal time to completion (Snyder and Dillow, 2011). And only about one in five students (21%) will transfer to a four-year institution within five years of enrolling at a community college (National Center for Education Statistics, 2011).
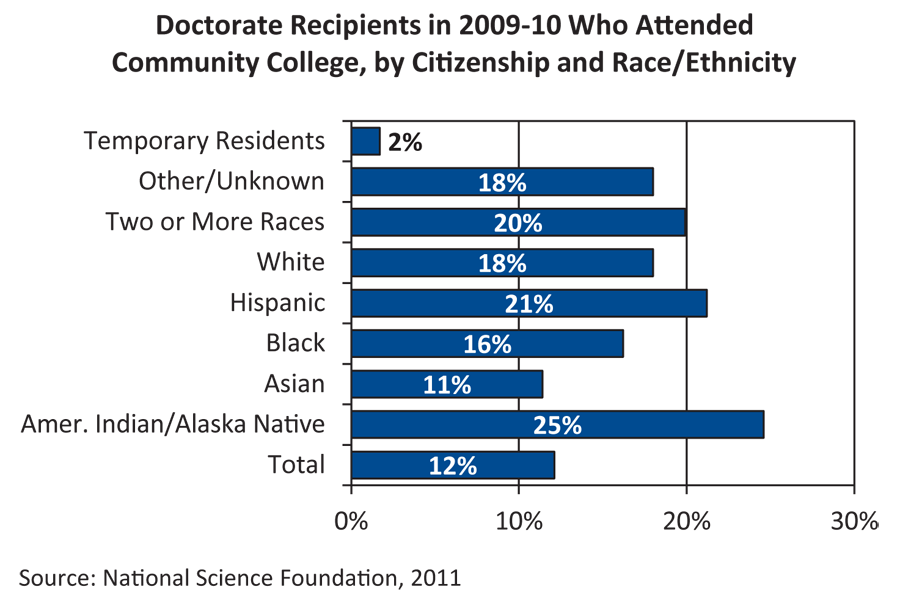
Despite the low completion and transfer rates for students at two-year institutions, data on recent doctorate recipients show that community college attendance can lead to graduate degree attainment. Among doctorate recipients in academic year 2009-10, 12% had earned college credit from a community or two-year college at some point on their academic path (National Science Foundation, 2011). These individuals may have taken just one course or may have earned a certificate or an associate’s degree from a two-year college. Women who earned their doctorates in 2009–10 were slightly more likely than men to have attended a two-year college at some point: 13.3% of women vs. 11.0% of men. Among US citizens and permanent residents, American Indians/Alaska Natives (25%) and Hispanics (21%) were most likely to have attended a two-year college (see Figure 1). In contrast, just 2% of temporary resident doctorate recipients in 2009–10 attended a two-year college at some point.
Figure 1
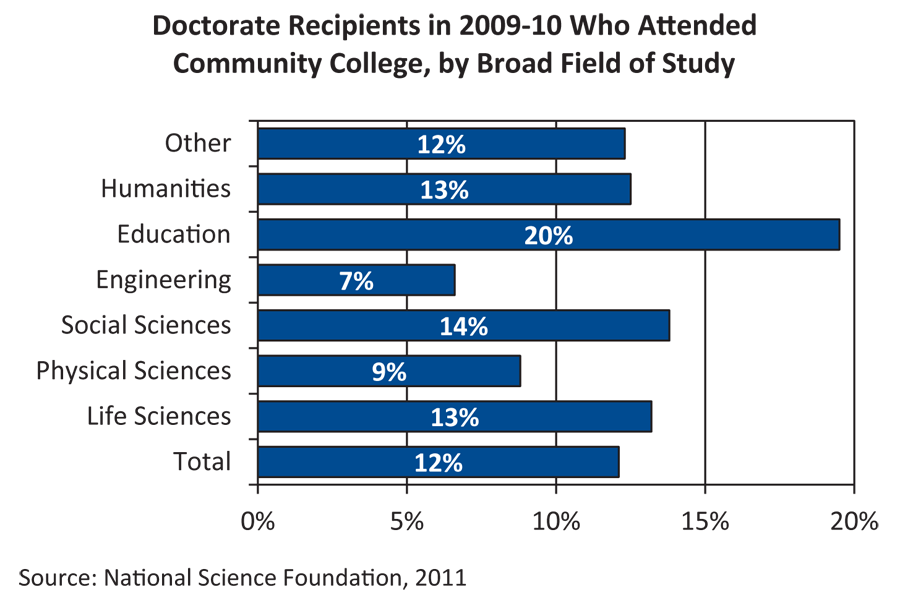
Individuals who earned a doctorate in education were most likely to have earned college credit from a community or two-year college (see Figure 2). One out of five doctorate recipients in education in 2009–10 had attended a two-year college at some point, along with 14% of those in social sciences, and 13% of those in both humanities and life sciences. Engineering doctorate recipients were least likely to have attended a community college, with just 7% reporting having done so.
Figure 2
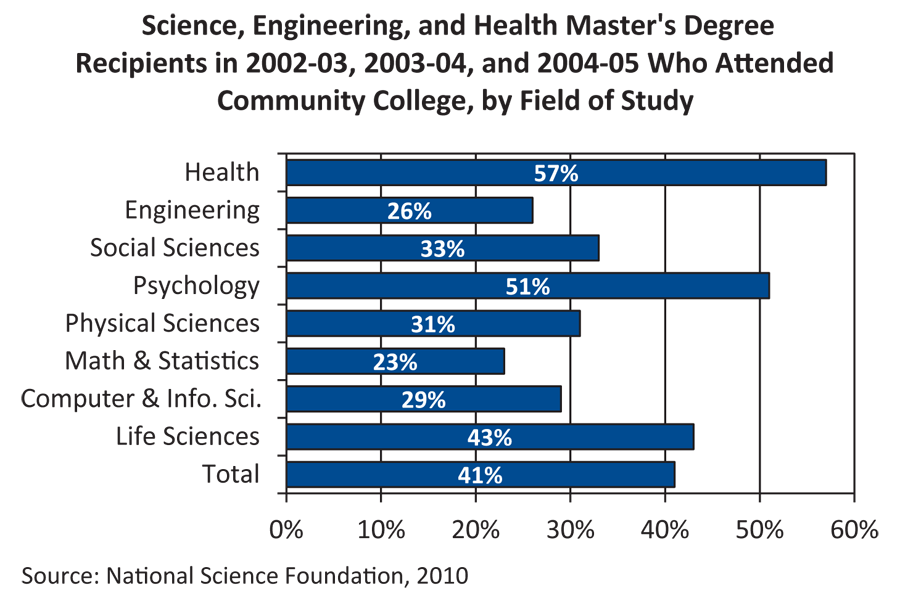
Community college attendance is even more prevalent among recent master’s degree recipients. Among individuals who earned master’s degrees in science, engineering, or health fields in academic years 2002–03, 2003–04, and 2004–05 (the most recent data available), 41% had taken at least one course at a community college at some point (National Science Foundation, 2010). As shown in Figure 3, master’s degree recipients in health fields were most likely to have taken a course at a two-year college (57%), and master’s degree recipients in mathematics and statistics were least likely to have done so (23%).
Figure 3
The findings are similar among recent bachelor’s degree recipients. Half (50%) of the individuals who earned bachelor’s degrees in science, engineering, or health fields in academic years 2002–03, 2003–04, and 2004–05 had attended a community college at some point (National Science Foundation, 2010). Bachelor’s degree recipients in health fields were again most likely to have taken a course at a two-year college (67%), while bachelor’s recipients in mathematics and statistics were again least likely to have done so (42%).
The data clearly show that many students who attend two-year colleges will eventually go on to earn bachelor’s degrees, master’s degrees, and doctorates. Getting more of the students who attend two-year institutions to go on to earn advanced degrees could help diversify the graduate student population. With higher percentages of underrepresented minorities, low socioeconomic status students, and first generation college students attending two-year institutions than four-year institutions, community colleges are an important source of tomorrow’s graduate students.
By Nathan E. Bell, Director, Research and Policy Analysis, Council of Graduate Schools
References:
National Center for Education Statistics. (2011). Community College Student Outcomes: 1994-2009. Retrieved from http://nces.ed.gov/pubs2012/2012253.pdf.
National Science Foundation. (2010). Characteristics of Recent Science and Engineering Graduates: 2006. Retrieved from http://www.nsf.gov/statistics/nsf10318/.National Science Foundation. (2011).
Doctorate Recipients from U.S. Universities: 2010. Retrieved from http://www.nsf.gov/statistics/sed/start.cfm.
Provasnik, S., and Planty, M. (2008).
Community Colleges: Special Supplement to The Condition of Education 2008. National Center for Education Statistics, Institute of Education Sciences, US Department of Education: Washington, DC.
Snyder, T.D., and Dillow, S.A. (2011). Digest of Education Statistics, 2010. National Center for Education Statistics, Institute of Education Sciences, US Department of Education: Washington, DC.
The Council of Graduate Schools Strategic Consultations are led by recognized graduate leaders selected from CGS member institutions and informed by an on-campus or a virtual site-visit. Aligned with CGS research, benchmarking, and policy documents, consultations guide universities toward best practices for administering graduate education. Standard consultations include a two-consultant/two-day model and a three-consultant/three-day model. For institutions requiring immediate assistance, an emergency one-consultant/one-day model is available. Consultations are available to CGS member institutions, international affiliates, and non-members institutions.
A consultation is initiated by contacting Robert M. Augustine, CGS Senior Vice President Emeritus at raugustine@cgs.nche.edu or 217-549-5246 who will arrange an online discussion with the university leadership to create a consultation Assessment Profile. The profile details the areas of graduate study that the institution seeks to advance and prepares the consultants for the on-campus or virtual site-visit.
On campus site visit planning begins with confirmation of the consultants. The consultation team studies the Assessment Profile and university support materials. In collaboration with the university, the consultation team develops the site-visit agenda. Based on the model selected by the university, the consultants travel to campus and meet with institutional representatives who inform assessment of the areas outlined in the profile.
Virtual site visits also begin with confirmation of the consultants. The consultation team studies the Assessment Profile and university support materials. In collaboration with the university, the consultation team develops a virtual site-visit agenda. Based on the model selected by the university and using virtual technologies, the consultants hold discussions with institutional representatives who inform assessment of the areas outlined in the profile.
Integrating information obtained from the on-campus or virtual site visit, university documents, and CGS research, the consultants deliver a detailed report to the university. The report’s recommendations will align the university with best practices for administering its graduate mission with emphasis on the areas outlined in the Assessment Profile.
CGS provides on-site consultations and custom data reports to member and non-member institutions. Depending upon your strategic consultation topic, you may choose to combine services.
The Council of Graduate Schools also offers custom data reports inform strategic decision-making. The reports provide leaders with comparison data tailored to institutional Carnegie classification and mission based on benchmarking data, national surveys, and comprehensive data sets.
| Consultation Models and Options | Member Rate (2021) | Non-Member Rate (2021) |
| Emergency Consultation | ||
| One Day/One Consultant On-Campus or Virtual Option | ||
| Consultant Fee (Includes report) | $1,250 | $2,000 |
| Administrative Costs | $6,000 | $6,000 |
| Total Fees for On-Campus or Virtual Consultation* | $7,250 | $8,000 |
| Standard Consultation Model 1 | ||
| Two Days/Two Consultants On-Campus or Virtual Option | ||
| Consultant Fee | $5,000 | $8,000 |
| Administrative Costs | $6,000 | $8,000 |
| Total Fees for On-Campus or Virtual Consultation* | $11,000 | $16,000 |
| Standard Consultation Model 2 | ||
| Three Days/Three Consultants | ||
| Consultant Fee | $11,250 | $18,000 |
| Administrative Costs | $6,000 | $8,000 |
| Total Fees for On-Campus or Virtual Consultation* | $17,250 | $26,000 |
| International Consultations* | ||
| Fee per Consultant (Includes report) | $1,250/day | $2,000/day |
| Administrative Costs | $6,000 | $8,000 |
| Custom Data Reports | ||
| Data Analysis | $200/hour | $400/hour |
| Data Retrieval Costs | Actual expenses | Actual expenses |
| *For an On-campus Site Visit Option Add Consultant Travel, Meal, and Accommodation Expenses | ||
For more information on strategic consultations, please contact Robert Augustine, senior vice president, emeritus.
Contact:
Belle Woods
bwoods@cgs.nche.edu
(202) 223-3791
Washington, D.C. (January 18, 2012) – The Council of Graduate Schools (CGS) released the results of its second annual Professional Science Master’s Enrollment and Degrees Survey documenting applications, enrollments, and degrees awarded in Professional Science Master’s (PSM) programs. The PSM is an innovative graduate degree designed to allow students to pursue advanced training in science or mathematics, while simultaneously developing workplace skills highly valued by employers.
“PSM programs, with their direct link to meeting workforce demand, saw strong growth in applications and enrollments in 2011,” said Debra Stewart, CGS president. She added, “We know from student outcomes data that PSM graduates are highly successful in finding employment in their field. The partnerships between universities and employers exemplified by PSM programs can serve as a model for collaboration across sectors.”
This new report includes data on applications received and accepted for fall 2011, as well as enrollment data for fall 2011 and degrees awarded during the 2010-11 academic year, from 95% of all PSM programs worldwide. Additionally, the report offers comparisons to data from 2010, documenting growth in applications, admissions, and enrollment. Key findings include:
Applications:
First-Time Enrollment:
Total Enrollment:
Degrees awarded:
The report is available in pdf format at sciencemasters.com.
The Council of Graduate Schools (CGS) is an organization of over 500 institutions of higher education in the United States and Canada engaged in graduate education, research, and the preparation of candidates for advanced degrees. Among U.S. institutions, CGS members award 92% of the doctoral degrees and 77% of the master’s degrees.* The organization’s mission is to improve and advance graduate education, which it accomplishes through advocacy in the federal policy arena, research, and the development and dissemination of best practices.
* Based on data from the 2010 CGS/GRE Survey of Graduate Enrollment and Degrees
Data Sources: Measuring Interdisciplinarity
July 2012
Interdisciplinary study has long been a feature of graduate education and research, but measuring the scope and determining the nature of interdisciplinarity has proven a challenge for survey researchers. Three major data collection efforts on graduate education—the CGS/GRE Survey of Graduate Enrollment and Degrees, the U.S. Department of Education’s Integrated Postsecondary Education Data System (IPEDS), and the National Science Foundation’s Survey of Graduate Students and Postdoctorates in Science and Engineering—use taxonomies of fields of study to collect and analyze enrollment and degree data. While this is an efficient method for characterizing enrollment and degrees in programs of study that are based in a single discipline, it is somewhat less effective for measuring interdisciplinarity.
Data Sources: Graduate Student Loans and Debt
June 2012
Student loan debt in the United States is at a record high. In February 2012, the Federal Reserve Bank of New York released data indicating that student loan debt reached $867 billion in the fourth quarter of 2011, exceeding the $704 billion Americans owed in credit card debt (Federal Reserve Bank of New York, 2012). The Consumer Financial Protection Bureau puts the student loan debt figure even higher, reporting in March 2012 that student loan debt is estimated to exceed $1 trillion (Consumer Financial Protection Bureau, 2012). While the exact amount owed in student loans may be in question, it is clear that Americans collectively owe a tremendous amount of money in student loans.
Data Sources: Results from the 2012 CGS Pressing Issues Survey
May 2012
Graduate deans report that their top pressing issues in 2012 are about recruitment, admissions, and enrollment management, according to the Council of Graduate Schools’ (CGS) annual Pressing Issues Survey. Each year, CGS asks graduate deans at member institutions to identify the three most important or “pressing” issues or challenges they currently face. The findings from this Pressing Issues Survey inform CGS about the concerns of graduate deans and help to shape sessions at Summer Workshops, Annual Meetings, and other forums, as well as future best practices projects. The survey has been conducted annually as part of the CGS International Graduate Admissions Survey, Phase I: Applications since 2004 and through the CGS membership survey and other surveys in prior years.
2012 CGS International Graduate Admissions Survey, Phase I: Applications
April 2012
The results of the latest International Graduate Admissions Survey show that applications increased 9% between 2011 and 2012.
Data Sources: A Profile of McNair Scholars
April 2012
The Ronald E. McNair Post-Baccalaureate Achievement Program, also known as the McNair Scholars Program, is the largest federal effort aimed at preparing low-income, first-generation in college and minority undergraduates to pursue doctoral studies. The McNair Scholars Program is funded through the U.S. Department of Education’s TRIO programs and provides participants with research internships, faculty mentors, opportunities to present and publish results of their research, undergraduate teaching experience, and assistance with applying to and preparing for graduate school.
Data Sources: Strong Employment Growth Expected for Graduate Degree Recipients
March 2012
Individuals with graduate degrees will be in growing demand over the next several years, according to new employment projections from the Bureau of Labor Statistics (BLS). These projections are part of BLS’ biennial examination of expected long-term changes in employment by occupation, industry, level of education, and demographics. The data provide a comprehensive outlook of employment in the United States through 2020.
Data Sources: The Role of Community Colleges on the Pathway to Graduate Degree Attainment
January/February 2012
For many students, the academic journey leading to a graduate degree starts with community college. These institutions provide access to higher education for students who in some cases may not yet even realize that a master’s degree or a doctorate is attainable. For other students, community colleges provide an affordable and/or a convenient means of earning college credit prior to enrolling, or even while enrolled, in a four-year institution.leges on the Pathway to Graduate Degree Attainment
Enrollment and Degrees in Professional Science Master’s (PSM) Programs: 2011
January 2012
The 2011 Professional Science Master’s Enrollment and Degrees Survey collects data on overall enrollment and degrees awarded in Professional Science Master’s (PSM) programs. It is the second such survey conducted by the Council of Graduate Schools (CGS) with a grant from the Alfred P. Sloan Foundation.
The 2011 Professional Science Master’s Enrollment and Degrees Survey collects data on overall enrollment and degrees awarded in Professional Science Master’s (PSM) programs. It is the second such survey conducted by the Council of Graduate Schools (CGS) with a grant from the Alfred P. Sloan Foundation.
PSM program directors and graduate deans (or equivalent) representing 241 PSM programs from 111 institutions of higher education were invited to provide data regarding the number of applications received for admission for the fall term of 2011, the number of applications accepted for the fall term of 2011, the number of first-time enrollees for the fall term of 2011, the total number of enrollees for the fall term of 2011, and the number of degrees awarded during the 2010/11 academic year (July 1, 2010 to June 30, 2011). The survey generated 230 usable responses, for a 95% response rate. Of these, 212 reported students who were either enrolled in a PSM program in the fall term of 2011 or graduated from a PSM program during the 2010/11 academic year.
To download the complete report, please click here.
Data Buddies: Partnering for Comparison Data
June 20, 2012
The Computing Research Association’s Data Buddies project gathers data on undergraduate and graduate students from a sample of computing departments nationwide. Two waves of surveys so far have helped improve evaluation of several broadening participation programs by developing a comparison group of nonparticipating students; in addition, the responses are a rich source of data on students’ decisions about graduate school and research careers.
Data on Faculty: What Are We Missing
May 16, 2012
John Curtis, Director of Research and Public Policy at the American Association of University Professors, discussed the state of data collection on faculty at U.S. universities and provided data from AAUP’s latest Annual Report on the Economic Status of the Profession.
It’s not your father’s Cadillac! The Transformation of the US from a High School to a College Economy
April 18, 2012
At this forum, Jeff Strohl from Georgetown University’s Center on Education and the Workforce highlighted some of the Center’s recent work on supply and demand, including data from a recent publication, Hard Times, which focuses on employment prospects by major.
Employment Projections, 2010-20
March 21, 2012
The latest employment projections from the Bureau of Labor Statistics were presented at this forum, with a special focus on the projected growth in jobs that typically require a master’s degree or a doctorate.
Trends in Master’s Education
February 15, 2012
This forum provided an overview of recent trends in master’s education from the viewpoint of four disciplinary organizations. Presenters discussed trends in enrollment, degrees, student demographics, financing, and more.
Design Changes to NSF, SESTAT Database
January 18, 2012
Staff from NSF provided an overview of design changes being considered for the SESTAT surveys and solicited input from attendees on data needs and analytical interests.
Too Many? Too Few? Supply and Demand for New Doctorate Recipients
November 16, 2011
Policymakers and educators periodically debate the undersupply or oversupply of new doctorate recipients. At this forum, representatives from four professional societies discussed current supply and demand issues and the state of the job market for new doctorate recipients in their respective disciplines.
Professional Science Master’s (PSM) Degrees: Enrollment, Degrees, and Outcomes
October 19, 2011
PSM programs, which combine rigorous study in science and/or mathematics with coursework in management, policy, law, or related fields, are designed to prepare graduates for careers in business, government, and non-profit organizations. This forum provided an overview of the PSM initiative, along with recent data on PSM enrollment and degrees and employment outcomes for PSM degree recipients, based on surveys conducted by the Council of Graduate Schools.
Selected Results from the 2008 Survey of Doctorate Recipients
September 14, 2011
This presentation provided a brief description of the Survey of Doctorate Recipients (SDR) methodology, followed by some of the latest findings pertaining to doctoral scientists and engineers in the US. Results focused on demographic characteristics, field of doctorate, and employment sector.
Trends in Student Financing of Graduate and First-Professional Education: 1995/96 to 2007/08
May 18, 2011
Using nationally representative data from graduate students participating in the National Postsecondary Student Aid Study (NPSAS), this presentation provides trend statistics on how graduate and first-professional students finance their education.
An Examination of Disciplines and Interdisciplinarity in NSF’s GRFP and IGERT Data
April 20, 2011
Gisele Muller-Parker from the National Science Foundation’s Graduate Research Fellowship Program (GRFP), provided a historical perspective on the evolution of disciplinary fields of study over time using 60 years of data from the GRFP. Ram Ramasubramanian provided an overview of the NSF IGERT interdisciplinary training program and examined how interdisciplinary fields of study may be integrated into this framework.
Tracking Graduate Student Outcomes: Best Practices from Society Surveys
March 15, 2011
Three presenters discussed the methodologies used by professional societies to track employment and education outcomes for graduate students, as well as the challenges they have overcome in collecting data, challenges that have yet to overcome, and ways in which the data are used by professional societies.
Refueling the U.S. Innovation Economy: Fresh Approaches to STEM Education
February 16, 2011
Robert Atkinson presented the findings of a new ITIF report that challenges the U.S. approach to STEM education and argues that reforms are urgently needed to better match the talents of students, the needs of employers, and our goals as a nation.
Diversifying Scientific Leadership: Making Effective Faculty Diversity Programs Legally Sustainable
January 19, 2011
Daryl Chubin, founding Director of the Center for Advancing Science and Engineering Capacity at AAAS, presented an overview of the Center’s recent work in support of the efforts of colleges and universities to diversify their faculty ranks.
A Data-Based Assessment of Research-Doctorate Programs in the United States
November 16, 2010
Charlotte Kuh, Deputy Executive Director of the Policy and Global Affairs Division at the National Research Council, discussed the NRC’s recently-released study of research-doctorate programs, highlighted how to use the database itself, and discussed ways that the data could be used for research and for the improvement of doctoral education.
Projections of Jobs and Education Requirements through 2018
October 20, 2010
This presentation featured highlights from Help Wanted: Projections of Jobs and Education Requirements through 2018, a recent publication from the Center on Education and the Workforce (CEW) at Georgetown University. One of the reports authors discussed the demand for graduate-level workers and the impact of a projected shortfall by 2018 in the supply of workers with postsecondary education and training.
NSF/SRS Update on Higher Education R&D Survey and Postdoc Data Project
September 22, 2010
Staff members from the National Science Foundation’s Division of Science Resources Statistics provided an update on NSF’s Postdoc Data Project, including the methodological results, and discussed recent developments for the redesigned Higher Education R&D Survey.
The Path Forward: The Future of Graduate Education in the United States
May 20, 2010
Cathy Wendler from the Educational Testing Service (ETS) provided an overview of a report guided by the Commission on the Future of Graduate Education, a group jointly formed by CGS and ETS in 2009 to study how graduate education can meet the challenges of the 21st century. Her presentation included current trends in graduate education, vulnerabilities in our system of graduate education, and the report’s recommendations and actions.
Graduate Education in Germany
April 14, 2010
Jürgen Breitkopf from the Deutsche Forschungsgemeinschaft (DFG), Germany’s funding organization for research in science, engineering and humanities, provided an overview of the DFG and the structure and funding of graduate education in Germany.
The Federal Workforce
March 17, 2010
This presentation by Tim McManus, Vice President for Education and Outreach at The Partnership for Public Service, covered three main topics: “Where the Jobs Are” in the federal government, barriers to entering the federal workforce, and what can be done to ensure the federal government gets the workforce it needs.
Minorities in Graduate Education
February 17, 2010
Mikyung Ryu from the American Council on Education provided an overview of the participation of minorities in graduate education based on data from ACE’s Minorities in Higher Education reports. Deborah Santiago, from Excelencia in Education, focused on Hispanics in graduate education.
Findings from the 2007-08 Survey of Earned Doctorates
January 20, 2010
This forum highlighted findings from the recently released Survey of Earned Doctorates Summary Report for 2007-08, focusing on longer term trends in doctoral degree production, educational history including time-to-degree and graduate school debt, and postgraduation plans of doctorate recipients.
International Graduate Students
November 17, 2009
The forum highlighted trends in study abroad for graduate students and presented statistics on international graduate students at U.S. institutions.
Applications for Fall 2009 in MBA, MPA/MPP, and MD Programs
October 21, 2009
Three speakers presented fall 2009 applications data from their recently released surveys.
Graduate Enrollment and Degrees: 1998 to 2008
September 16, 2009
Using data from the latest CGS/GRE Survey of Graduate Enrollment and Degrees, this presentation includes data and trends on applications for admission to graduate school, first-time and total graduate student enrollment, and graduate degrees and certificates conferred.
Findings from Exit Surveys of Ph.D. Completers
June 17, 2009
Using data from Ph.D. Completion and Attrition: Findings from Exit Surveys of Ph.D. Completers, a new publication from the Council of Graduate Schools, Robert Sowell presented on factors that contribute to Ph.D. completion, as reported by the graduates themselves.
The Humanities Indicators: What They Tell Us about Graduate Education
May 20, 2009
This forum provided an overview of the Humanities Indicators, a prototype set of statistical data about the humanities in the United States. The Indicators include data on undergraduate and graduate degrees in the humanities, employment of humanities graduates, levels of program funding, public understanding of the humanities, and other areas of concern in the humanities.
Master’s Degrees in STEM
April 15, 2009
Presenters at this forum addressed trends in master’s degree production, the nature of the master’s degree in their discipline (i.e. terminal vs. en route, professional vs. research, required vs. optional, etc.), outcomes for master’s degree recipients, funding for master’s students, and data on master’s-level completion and attrition.
Distance Education at the Graduate Level
March 18, 2009
This forum provided current data on the scope of distance learning at the graduate level, based on data from “Distance Education at Postsecondary Institutions: 2006-07,” a recent NCES publication.
The Current Employment Situation for Graduate Degree Recipients by Discipline
February 18, 2009
This forum addressed recent employment trends for graduate degree recipients by discipline and the anticipated employment situation for individuals graduating with master’s degrees and doctorates in spring 2009.
International Comparisons of Graduate Education
January 21, 2009
Data were presented showing how the United States compares internationally on metrics such as participation in and completion of doctoral programs and how international participation in higher education has changed over the past decade.
(Reprinted from the January/February 2011 issue of the CGS Communicator)
Hispanic-serving institutions (HSIs) play an important role in graduate education. According to the Hispanic Association of Colleges and Universities (HACU), HSIs are defined as “…colleges, universities, or systems/districts where total Hispanic enrollment constitutes a minimum of 25% of the total enrollment. ‘Total Enrollment’ includes full-time and part-time students at the undergraduate or graduate level… (Hispanic Association of Colleges and Universities, 2011).” The federal government does not maintain an official list of HSIs, but as of January 2011, HACU listed 230 member HSIs on its website. Of those institutions, 53 award graduate degrees and are included in the survey population for the CGS/GRE Survey of Graduate Enrollment and Degrees. It is important to note that since the enrollment share of Hispanic students at individual institutions varies from year to year, the list of institutions considered HSIs also varies from year to year. This article examines graduate enrollment at institutions classified as HSIs by HACU as of January 2011.
Findings
The Hispanic population in the United States has increased rapidly over the past two decades. Hispanics comprise about 16% of the U.S. resident population today, up from about 13% in 2000 and 9% in 1990 (U.S. Census Bureau, 2000, 2002, and 2008). The U.S. Census Bureau estimates that by 2050, 30% of all U.S. residents will be Hispanic (U.S. Census Bureau, 2008).
Partly as a result of this population growth, the participation of Hispanics in graduate education has increased as well. In fall 2009, 8.4% of all U.S. citizen and permanent resident graduate students were Hispanic, up from 6.7% in 1999 and 3.9% in 1989 (Council of Graduate Schools, 2010). Yet, Hispanics remain underrepresented in graduate education. Their share of the U.S. population today is twice as large as their share of U.S. citizen and permanent resident graduate enrollment.
In fall 2009, 36% of all Hispanic graduate students attended HSIs, relatively unchanged from 37% a decade earlier in fall 1999 (Council of Graduate Schools, 2010). However, Hispanic graduate students are less likely to be enrolled at HSIs today than they were twenty years ago. In fall 1989, 44% of all Hispanic graduate students were enrolled at institutions now classified as HSIs. Despite a smaller share of Hispanics attending HSIs today, the large increase in Hispanic graduate enrollment over the past two decades has resulted in larger numbers of Hispanics at both HSIs and non-HSIs.
On average, graduate students at HSIs are more likely to be enrolled at the master’s level than students at non-HSIs. In fall 2009, 85% of all graduate students attending HSIs were enrolled at the master’s level compared with 75% of the graduate students at all other institutions (Council of Graduate Schools, 2010).
Over the past twenty years, the overall growth in graduate enrollment (including students of all citizenships and races/ethnicities) has been greater at HSIs than at all other institutions (see Table 1). Between fall 1989 and fall 2009, total graduate enrollment increased 58% at HSIs and 40% at all other institutions (Council of Graduate Schools, 2010). In contrast, over the last one-, five-, and ten-year periods, the gains were greater at non-HSIs than at HSIs. For example, between fall 2004 and fall 2009, total graduate enrollment increased 6% at HSIs, less than half the 13% rate of increase at all other institutions.

For Hispanic graduate students, the enrollment growth that occurred over the past two decades happened in both HSIs and non-HSIs, but was greater at non-HSIs than at HSIs (see Table 2). Between fall 1989 and fall 2009, Hispanic graduate enrollment increased 229% at non-HSIs compared with 132% at HSIs (Council of Graduate Schools, 2010). Similarly, the rate of increase in Hispanic graduate enrollment between fall 1999 and fall 2009 was 76% at non-HSIs compared with 52% at HSIs. Over the last five years, most of the growth in Hispanic graduate enrollment has been at non-HSIs. Hispanic graduate enrollment increased just 7% at HSIs between fall 2004 and fall 2009, but rose 33% at all other institutions.

Implications
While the gains for Hispanics in graduate education at both HSIs and non-HSIs are encouraging, there remains a long way to go before parity is reached. And the barriers to achieving parity remain great. The two primary barriers are the high dropout rates for Hispanics in high school and the low enrollment rates of Hispanics in undergraduate education. In 2008, 18% of Hispanic 16- through 24-year-olds were not enrolled in high school and had not earned a high school diploma or alternative credential (Chapman, Laird, and KewalRamani, 2010). In contrast, just 4% of Asian/Pacific Islanders, 5% of Whites, and 10% of African Americans were high school dropouts. And among high school graduates ages 16 to 21 in 2006, 79% of Asians and 61% of Whites were enrolled in college, compared with 49% of African Americans and 45% of Hispanics (Davis and Bauman, 2008).
Given these high dropout rates from high school and low enrollment rates in undergraduate education, it is not surprising that the educational attainment of the Hispanic population also lags that of other racial groups. In 2009, just 3% of Hispanics 25 years of age and older in the United States had a graduate degree, compared with 10% of Whites and 6% of African Americans (Snyder and Dillow, 2010). The pathways to graduate school must be improved in order to ensure parity for Hispanics in graduate degree attainment. To achieve this goal will require the participation and support of HSIs as well as non-HSIs.
By Nathan E. Bell, Director, Research and Policy Analysis
References
Chapman, C., Laird, J. and KewalRamani, A. (2010). Trends in High School Dropout and Completion Rates in the United States: 1972–2008. Washington, DC: National Center for Education Statistics, U.S. Department of Education. Retrieved from http://nces.ed.gov/pubsearch
Council of Graduate Schools. (2010). CGS/GRE Survey of Graduate Enrollment and Degrees. Dataset.
Davis, W. and Bauman, K. (2008). School Enrollment in the United States: 2006. Washington, DC: U.S. Census Bureau. Retrieved from http://www.census.gov/prod/2008pubs/p20-559.pdf
Hispanic Association of Colleges and Universities. (2011). “Hispanic-Serving Institution Definitions.” Retrieved from http://www.hacu.net/hacu/HSI_Definition_EN.asp?SnID=166172461
Snyder, T. and Dillow, S. (2010). Digest of Education Statistics 2009. Washington, DC: National Center for Education Statistics, U.S. Department of Education.
U.S. Census Bureau. (2000). “Resident Population Estimates of the United States by Sex, Race, and Hispanic Origin: April 1, 1990 to July 1, 1999, with Short-Term Projection to November 1, 2000.” Retrieved from http://www.census.gov/popest/archives/1990s/nat-srh.txt
U.S. Census Bureau. (2002). “U.S. Summary: 2000.” Retrieved from http://www.census.gov/prod/2002pubs/c2kprof00-us.pdf
U.S. Census Bureau. (2008). “An Older and More Diverse Nation by Midcentury.” Retrieved from http://www.census.gov/newsroom/releases/archives/population/cb08-123.html
U.S. Census Bureau. (2010). “Table 4: Annual Estimates of the Hispanic Resident Population by Sex and Age for the United States: April 1, 2000 to July 1, 2009). Retrieved from http://www.census.gov/popest/national/asrh/NC-EST2009/NC-EST2009-04-HISP.xls
(Reprinted from the March 2011 issue of the CGS Communicator)
Through the Current Population Survey (CPS), a monthly sample survey of approximately 60,000 households across the United States, the U.S. Census Bureau and the Bureau of Labor Statistics (BLS) collect data on the education level of the U.S. population and the income of employed individuals. The findings from the 2010 CPS surveys confirm that individuals with advanced degrees continue to earn more on average than individuals with lower levels of educational attainment.
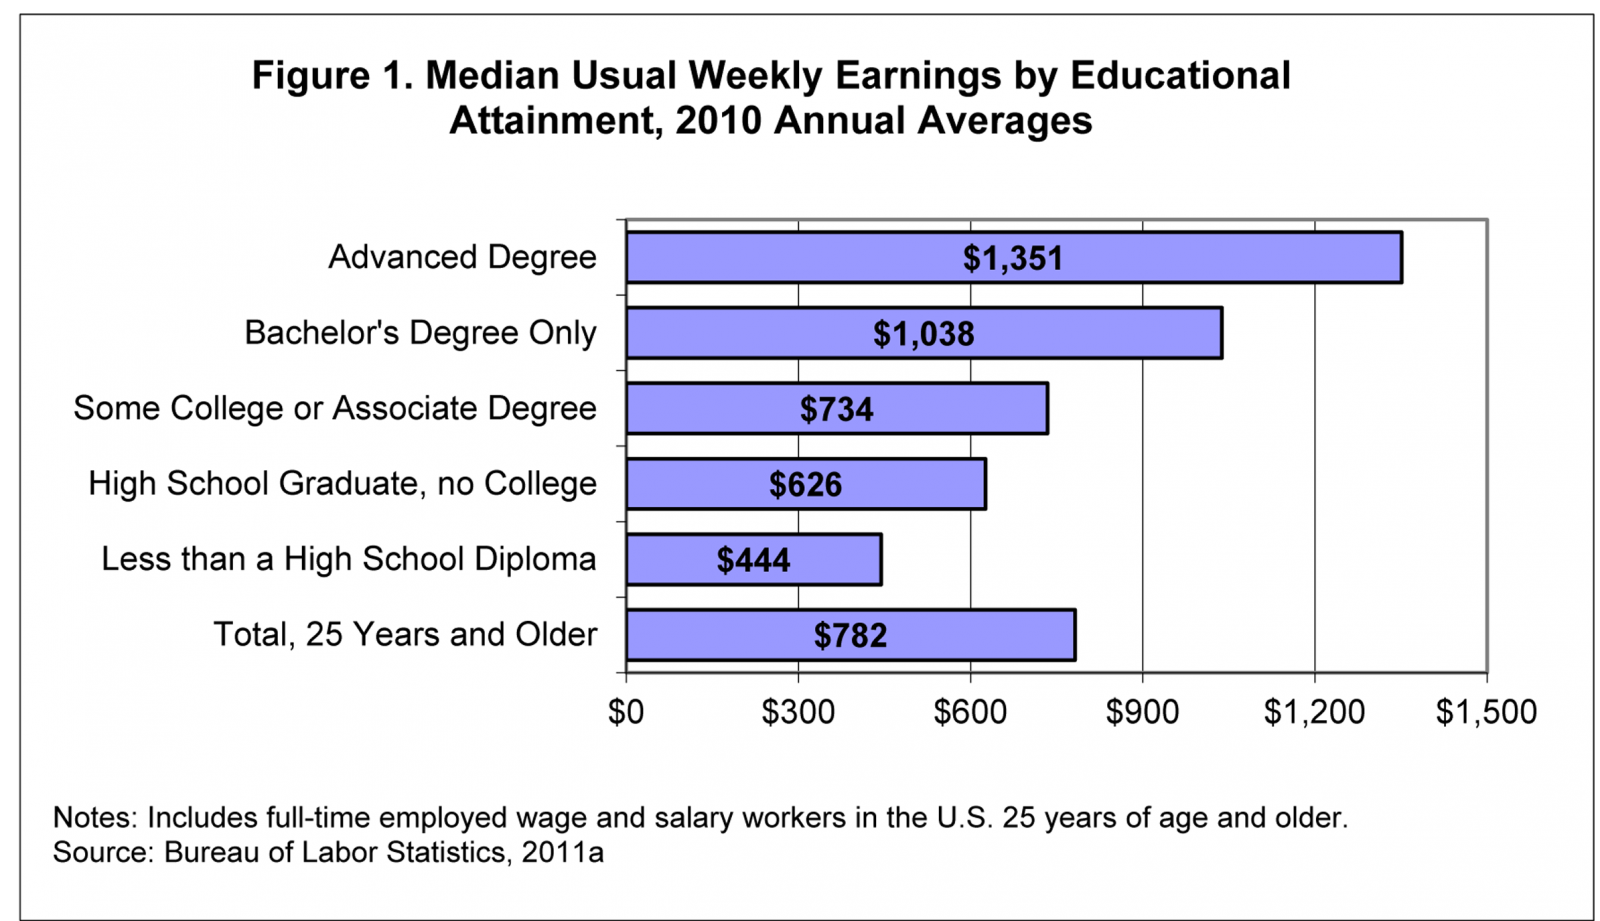
In 2010, among full-time employed wage and salary workers 25 years of age and older, the median usual weekly earnings of individuals with advanced degrees (master’s degrees, doctorates, or first-professional degrees) were $1,351 (Bureau of Labor Statistics, 2011a). This compares with median usual weekly earnings of $1,038 for individuals with a bachelor’s degree as their highest degree and $626 for individuals with only a high school diploma (see Figure 1). This wage premium means that individuals with advanced degrees earned 30% more in 2010 than individuals with a bachelor’s degree as their highest degree and more than twice as much as individuals with only a high school diploma. Overall, the median usual weekly earnings of all wage and salary workers 25 years of age and older was $782.
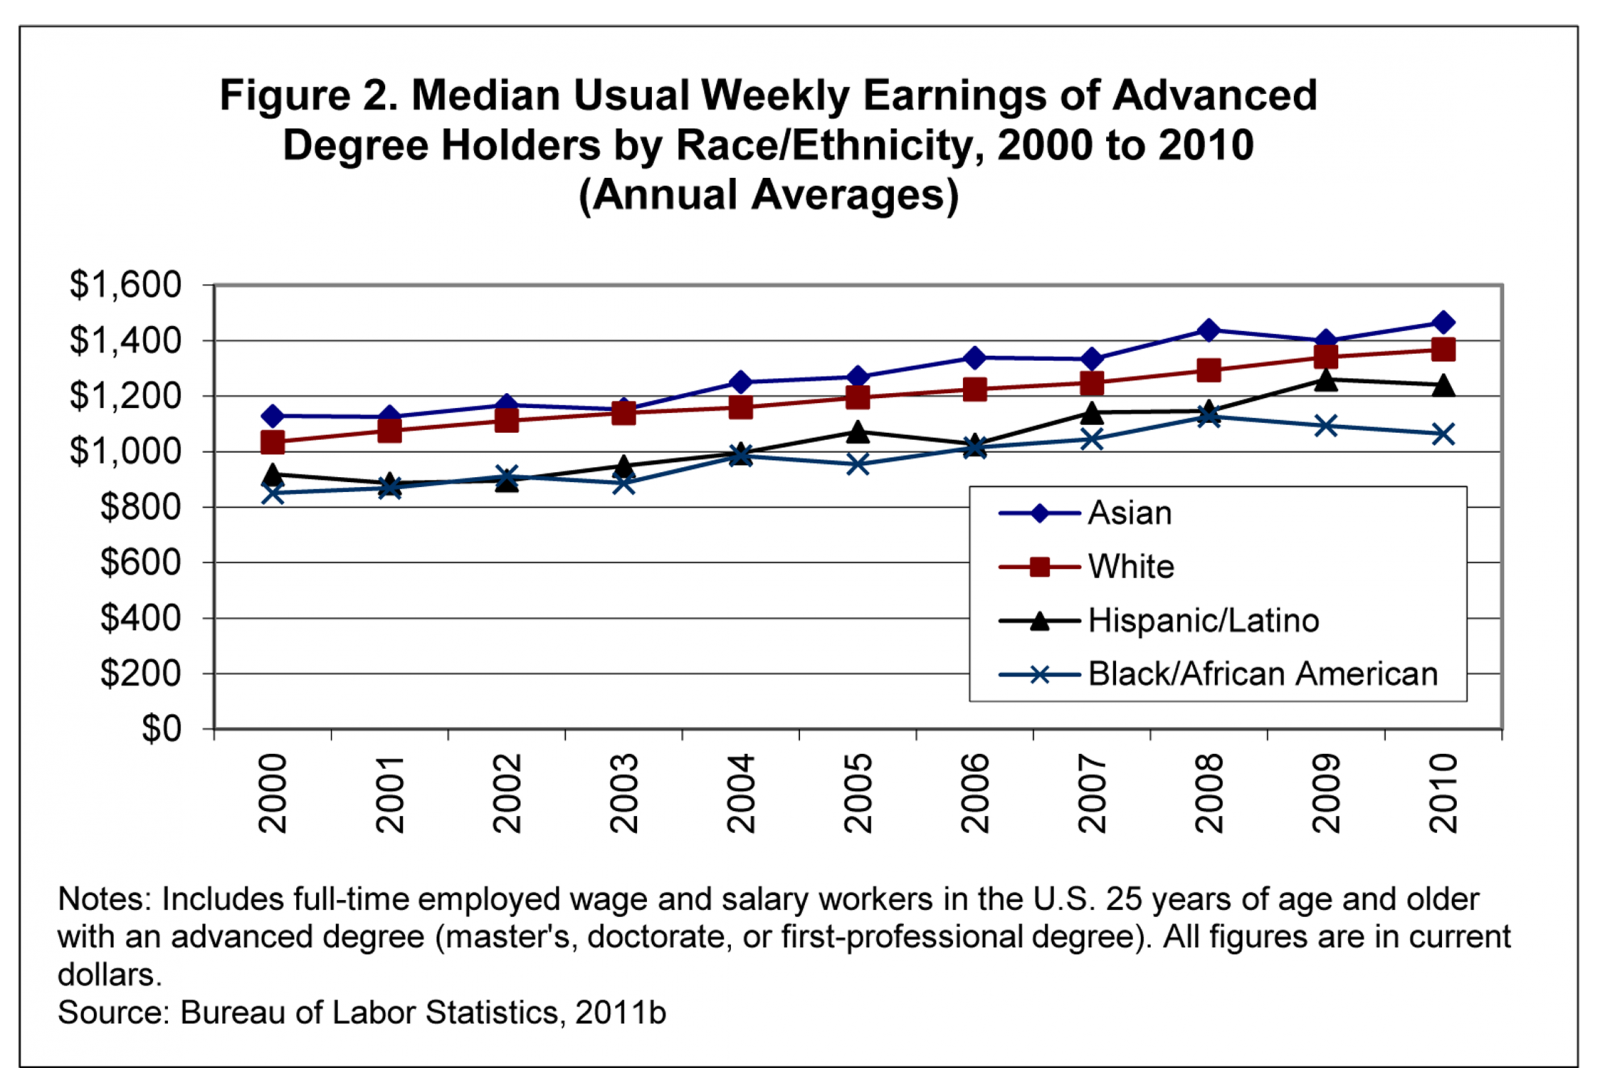
While advanced degree holders earned a median $1,351 per week in 2010, there were large differences by gender and race/ethnicity. Overall, men with advanced degrees earned about 34% more than women with advanced degrees – $1,552 for men versus $1,158 for women (Bureau of Labor Statistics, 2011a). By race/ethnicity, Asian and white workers with advanced degrees earned more than their Hispanic/Latino and Black/African American counterparts (see Table 1). Median usual weekly earnings ranged from a high of $1,466 for Asian workers to a low of $1,065 for Black/African American workers. Within every race/ethnicity category, men earned more than women (see Table 1). White men earned about 35% more than white women, and Hispanic/Latino men earned about 23% more than Hispanic/Latino women. Black/African American men also earned more than Black/African American women, but the wage premium was smaller than in other race/ethnicity categories, with Black/African American men earning 16% more than Black/African American women. Among all workers with advanced degrees, Black/African American women had the lowest median weekly earnings at $1,010, and white men had the highest median weekly earnings at $1,552, about 54% more than the median weekly earnings of Black/African American women.

Among advanced degree holders, the wage premium for men has remained relatively constant over the past decade. In 2000, the median usual weekly earnings of men were 33% higher than the median usual weekly earnings of women – $1,172 versus $881 (Bureau of Labor Statistics, 2011b). A decade later in 2010, men with advanced degrees earned 34% more than women with advanced degrees as noted above, virtually the same wage premium as in 2000.
While the wage differences by gender have remained relatively constant over the past decade, wage differences by race/ethnicity have shifted (see Figure 2). In 2000, the median usual weekly earnings of Asians with advanced degrees were 23% higher than the median usual weekly earnings of Hispanics/Latinos ($1,129 versus $919) (Bureau of Labor Statistics, 2011b). But by 2010, the wage premium for Asians decreased to 18% ($1,466 for Asians versus $1,241 for Hispanics/Latinos), indicating that wages increased faster for Hispanics/Latinos than for Asians over the decade thereby decreasing the gap. Similarly, the median usual weekly earnings for whites with advanced degrees were 13% higher in 2000 than the median usual weekly earnings for Hispanics/Latinos ($1,034 versus $919), and the wage premium for whites decreased to 10% in 2010 ($1,368 for whites versus $1,241 for Hispanics/Latinos).
Not all of the shifts by race/ethnicity were in positive directions; Blacks/African Americans with advanced degrees lost ground on earnings over the past decade compared with their Asian and white peers. In 2000, Asians with advanced degrees earned 33% more than their Black/African American peers ($1,129 versus $851); in 2010, Asians earned 38% more ($1,466 versus $1,065). Whites with advanced degrees earned 22% more than their Black/African American peers in 2000 ($1,034 versus $851); in 2010, they earned 29% more ($1,368 versus $1,065). While median earnings for Blacks/African Americans with advanced degrees increased overall between 2000 and 2010 in current dollars, this gain was outpaced by the gains for Asians and whites. Furthermore, Blacks/African Americans experienced a decline in median earnings in 2009 and 2010 during the recession, thereby adding to the wages differences between Blacks/African Americans and Asians and whites.
The data from the CPS clearly show that higher education is a gateway to careers with higher-earnings potential, but they also reveal that disparities remain in earnings by gender and race/ethnicity. It is important, however, to note that the figures presented in this article do not control for field of study, occupation, length of professional employment, and other variables that might explain some (but not all) of the differences in earnings by gender and race/ethnicity.
Two factors in particular contribute to lower median earnings for women than for men. First, women with advanced degrees are more likely than men to be employed in some occupations in which salaries are lower, such as teaching, and less likely to be employed in some occupations with higher median salaries, such as engineering (Bureau of Labor Statistics, 2010). Second, women comprise a larger share of new employees with advanced degrees today than they did even a decade ago. In 1999-00, women earned 58% of all master’s degrees and 44% of all doctorates; by 2008-09 (the latest year for which data are available) they earned 60% of all master’s degrees and 50% of all doctorates (Council of Graduate Schools, 2010). This means that women are more concentrated than men in the portion of the advanced degree workforce that is younger and has fewer years of professional experience. This portion of the workforce tends to have lower earnings than older, more experienced workers.
Similarly, underrepresented minorities (Native Americans, Blacks/African Americans, and Hispanics/Latinos) are also more concentrated in the younger and less experienced portion of the advanced degree workforce. In 1999-00, underrepresented minorities earned 14% of all master’s degrees awarded to U.S. citizens and permanent residents and 11% of all research doctorates, compared with 18% of the master’s degrees and 13% of all research doctorates in 2008-09 (National Science Foundation, 2010 and 2011).
While differences in earnings by gender and race/ethnicity are evident in the CPS data, what is also evident is that regardless of gender or race/ethnicity, individuals with advanced degrees earn a higher median salary than their counterparts with lower levels of educational attainment. Advanced degrees do not guarantee higher wages, but they are often the pathway to occupations with greater economic rewards.
By Nathan E. Bell, Director, Research and Policy Analysis
References
Bureau of Labor Statistics. (2010). “Median Weekly Earnings of Full-time Wage and Salary Workers by Detailed Occupation and Sex.” Retrieved from http://bls.gov/cps/cpsaat39.pdf
Bureau of Labor Statistics. (2011a). “Table 9. Quartile and Selected Deciles of Usual Weekly Earnings of Full-time Wage and Salary Workers by Selected Characteristics, 2010 Annual Averages.” Retrieved from http://www.bls.gov/news.release/pdf/wkyeng.pdf
Bureau of Labor Statistics. (2011b). “Weekly and Hourly Earnings Data from the Current Population Survey.” Retrieved from http://data.bls.gov/onescreen/?survey=le
Council of Graduate Schools. (2010). CGS/GRE Survey of Graduate Enrollment and Degrees. Dataset.
National Science Foundation. (2010). Doctorate Recipients from U.S. Universities: 2009. Retrieved from http://www.nsf.gov/statistics/nsf11306
National Science Foundation. (2011). WebCASPAR Integrated Science and Engineering Resources Data System. Dataset. Accessed February 9, 2011.
(Reprinted from the April 2011 issue of the CGS Communicator)
For more than 25 years, the Council of Graduate Schools, in partnership with the Graduate Record Examinations (GRE) Board, has collected and published data on graduate enrollment and degrees in U.S. colleges and universities (Council of Graduate Schools, 2010). Similar data are published by the Canadian Association for Graduate Studies for institutions in Canada (Canadian Association for Graduate Studies, 2011). While differing definitions and methodologies prevent exact comparisons between the two sources, the data illuminate some similarities as well as some differences in the graduate student populations of the U.S. and Canada.
One major difference between graduate enrollment in the U.S. and in Canada is the size of the graduate student population. Graduate enrollment in the U.S. is more than ten times larger than graduate enrollment in Canada. Institutions responding to the CGS/GRE Survey of Graduate Enrollment and Degrees reported enrolling a total of nearly 1.75 million students in U.S. graduate programs in 2008. In contrast, graduate enrollment in Canada totaled about 172,000 students in that same year.
Graduate enrollment is increasing slightly faster in Canada than in the U.S. Since 1999, graduate enrollment has grown by 5.3% annually on average in Canada, compared with a 3.7% average annual increase in the U.S.
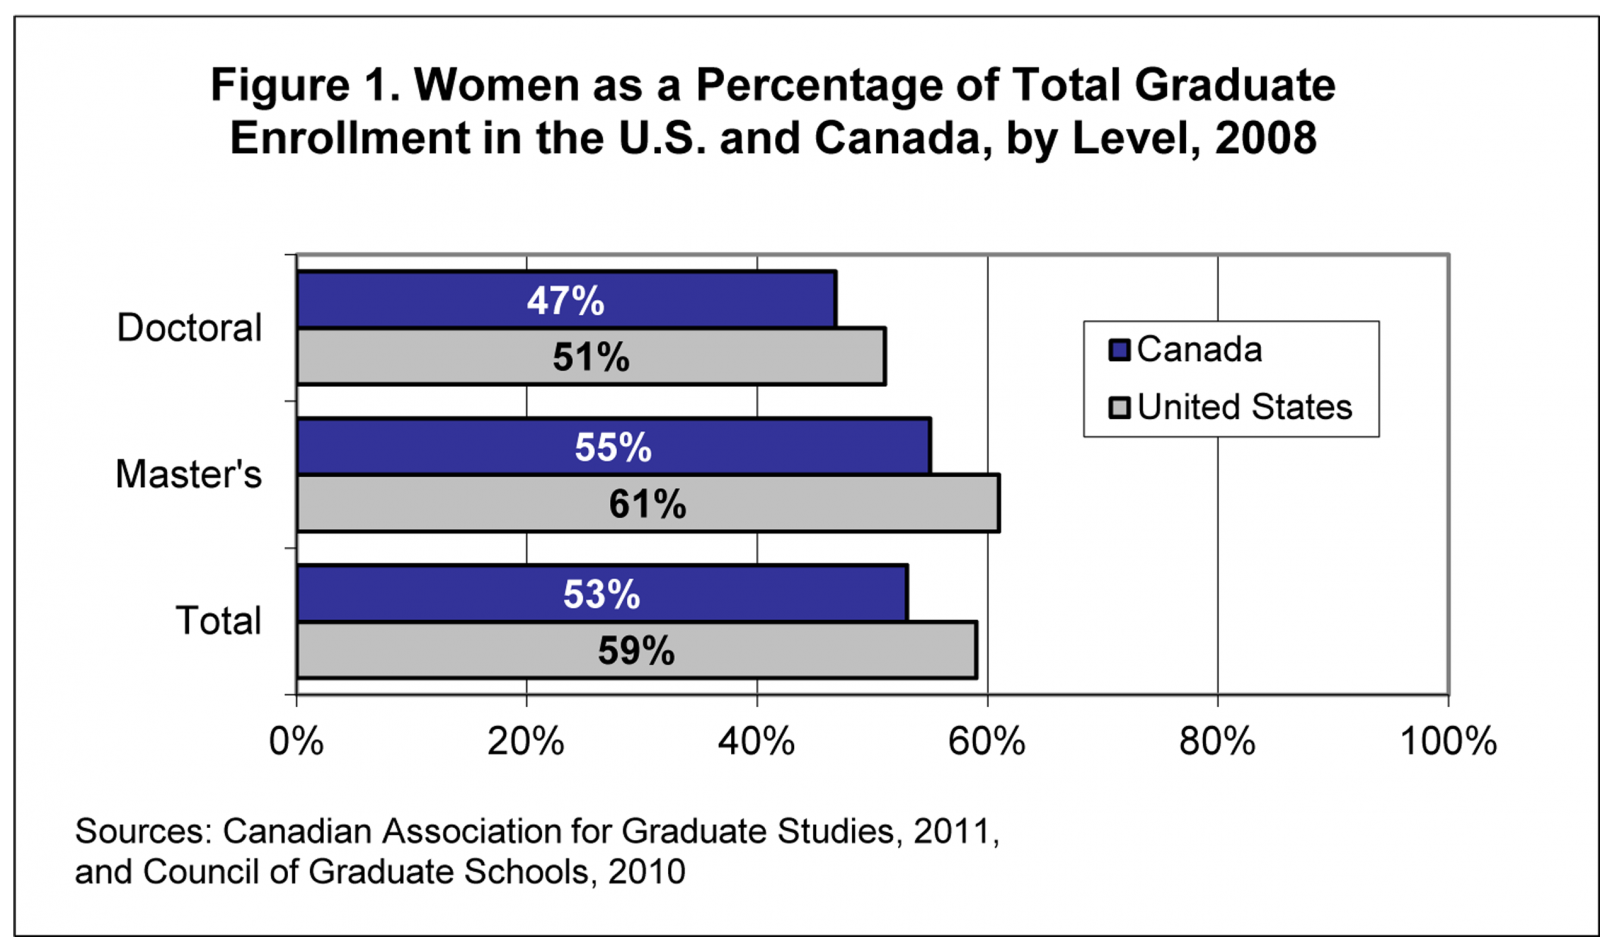
In both the U.S. and Canada, the majority of all graduate students are women. In 2008, women comprised 59% of all U.S. graduate students and 53% of all Canadian graduate students (see Figure 1). In both countries, women accounted for a larger share of master’s enrollment than doctoral enrollment. In the U.S., 61% of all students enrolled in master’s programs in 2008 were women, and 51% of doctoral enrollees were women. Similarly, in Canada women comprised 55% of master’s enrollees and 47% of doctoral enrollees in 2008. The share of women in graduate enrollment is on the rise in both the U.S. and Canada, increasing from 55% in 1999 to 59% in 2008 in the U.S. and from 50% to 53% in Canada over the same time period.
International students comprise a similar share of graduate enrollment in the U.S. and in Canada. In 2008, 16% of all graduate students in U.S. institutions were international, while in Canada, about 15% were international. In both countries, international students are more likely to be enrolled in science and engineering and business fields than in arts and humanities fields. The international student population in both countries increased as a share of total graduate enrollment between 1999 and 2008, but growth in Canada outpaced growth in the U.S. The international share of graduate enrollment increased from about 15.5% to 16% in the U.S. between 1999 and 2008, compared with a gain from 12% to 15% in Canada over the same time period.
International students at Canadian institutions are most likely to be from countries in Eastern and Southern Asia. At the master’s level in Canada, 3.1% of all students come from Eastern Asia and 2.0% from Southern Asia. At the doctoral level, 3.8% come from Southern Asia and 3.4% from Eastern Asia. While the CGS/GRE Survey of Graduate Enrollment and Degrees does not collect data on country of origin for international students attending institutions in the U.S., data from the CGS International Graduate Admissions Survey show that about half of all international students at U.S. graduate schools are from China, India, and South Korea (Bell, 2010), indicating the importance of students from Asian countries to the graduate school populations of both countries.
Graduate students in the U.S. are more likely to be enrolled part-time than graduate students in Canada. In 2008, 45% of all U.S. graduate students were enrolled part-time, compared with 26% of Canadian graduate students. In both countries, graduate students in education were among the most likely to be enrolled part-time.
In both the U.S. and Canada, the majority of all graduate degrees awarded each year are master’s degrees. In Canada, about 36,500 master’s degrees were awarded in 2008, compared with 5,400 doctorates. In the U.S., institutions responding to the CGS/GRE Survey of Graduate Enrollment and Degrees reported awarding over 488,000 master’s degrees in 2008, compared with about 56,000 doctorates.
In the U.S., education and business were the largest broad fields at the master’s level in 2008, accounting for 29% and 23%, respectively, of the master’s degrees awarded that year. In Canada, the largest broad field was business, management and public administration, accounting for 29% of all master’s degrees in 2008. The field of education is much smaller in Canadian institutions, with just 11% of all master’s degrees in 2008 awarded in that broad field.
At the doctoral level in the U.S., engineering and physical sciences were the largest broad fields, each accounting for about 15% of all doctorates awarded that year. In Canada, the broad field of physical and life sciences accounted for the largest share of doctorates awarded in 2008 (26%), followed by architecture, engineering, and related technologies (19%). While there are differences in the taxonomies used in the two data sources, the broad fields of engineering and physical sciences account for a large portion of the doctorates awarded each year in both Canada and the U.S.
While the size of graduate education in the U.S. dwarfs that of Canada, both countries have similar percentages of international students and similar trends in the participation of women in graduate education. They also share some similarities in the fields of study that comprise the majority of the graduate degrees awarded and the countries of origin of their international graduate students. And Canada and the U.S. have both experienced an increase in graduate enrollment over the past decade. The two data sets examined in this article, while not directly comparable, clearly document some shared trends in graduate education and highlight the value placed on graduate education in both Canada and the U.S.
By Nathan E. Bell, Director, Research and Policy Analysis
References
Bell, N.E. (2010). Findings from the 2010 CGS International Graduate Admissions Survey, Phase III: Final Offers of Admission and Enrollment. Washington, DC: Council of Graduate Schools.
Canadian Association for Graduate Studies. (2011). 39th Statistical Report: 1999-2008. Ottawa, ON: Canadian Association for Graduate Studies.
Council of Graduate Schools. (2010). CGS/GRE Survey of Graduate Enrollment and Degrees. Dataset.
(Reprinted from the May 2011 issue of the CGS Communicator)
Graduate deans report that their top pressing issues in 2011 are about recruitment, admissions, and enrollment management, according to the Council of Graduate Schools’ (CGS) annual Pressing Issues Survey. Each year, CGS asks graduate deans at member institutions to identify the three most important or “pressing” issues or challenges they currently face. The findings from this Pressing Issues Survey inform CGS about the concerns of graduate deans and help to shape sessions at Summer Workshops, Annual Meetings, and other forums, as well as future best practices projects. The survey has been conducted annually as part of the CGS International Graduate Admissions Survey, Phase I: Applications since 2004 and through the CGS membership survey and other surveys in prior years.
The 2011 Phase I survey was sent to 494 U.S. colleges and universities that were members of CGS as of January 2011. A total of 230 institutions responded to the survey, for a response rate of 47% (Bell, 2011). About 93% (213) of the Phase I survey respondents wrote in one or more pressing issues in response to this open-ended question, and the analyses below are limited to these 213 respondents. They included 155 doctoral institutions, 48 master’s-focused institutions, and 10 institutions classified as baccalaureate or specialized in the 2010 basic Carnegie Classifications. Sixty-two private, not-for-profit institutions responded to the Pressing Issues Survey, along with 151 public institutions. By geographic region, 54 of the responding institutions were in the Midwest, 42 were in the Northeast, 36 in the West, and 81 in the South. Responses to the Pressing Issues Survey were coded into broad categories. Since respondents were able to write in up to three pressing issues, the percentages sum to more than 100%.
Pressing Issues in 2011
The top pressing issue identified by graduate deans was recruitment, admissions, and enrollment management, mentioned by more than two-thirds (68%) of all respondents (see Table 1). Within this category, respondents mentioned competition for prospective graduate students, challenges in attracting a diverse applicant pool, recruiting international students, and recruiting quality graduate students, among other concerns. Respondents from master’s & specialized institutions were more likely to mention recruitment, admissions, and enrollment management than graduate deans from doctoral institutions (74% vs. 65%), and respondents from private, not-for-profit institutions were more likely to indicate that this was a pressing issue than those at public institutions (71% vs. 66%).
Graduate student financial support was the second most commonly mentioned pressing issue, with 54% of all respondents saying this was a concern. This category includes health insurance for graduate students, as well as direct support through assistantships, fellowships, etc. Graduate deans from doctoral institutions and master’s & specialized institutions were nearly equally as likely to indicate that graduate student financial support was a concern (54% vs. 52%). Respondents from public institutions, however, were more likely to note graduate student financial support as a pressing issue than respondents at private, not-for-profit institutions (56% vs. 48%).
Graduate program financing, dealing with budget cuts, and issues related to the economy ranked third (40%). Respondents from doctoral institutions were more likely to mention this issue than respondents from master’s & specialized institutions (43% vs. 34%), and respondents from public institutions were more likely to indicate that this issue was a concern than those from private, not-for-profit institutions (42% vs. 37%).
Student support and services was ranked as the fourth most pressing issue this year (28%). Within this category, respondents mentioned advising and mentoring, professional development for graduate students, career advice, and job placement assistance, among other concerns. Respondents from doctoral institutions were more likely to mention student support and services than graduate deans from master’s & specialized institutions (32% vs. 19%), and respondents from private, not-for-profit institutions were more likely to indicate that this was a pressing issue than those at public institutions (40% vs. 23%).
The percentages of respondents who mentioned the remaining pressing issues are shown in Table 1. General management and administration (21%) includes a wide variety of issues focused on areas such as policies and procedures, data management, and communications. All issues related to program quality; the evaluation, assessment, or review of graduate programs; accreditation; and student learning outcomes were grouped together as program quality, evaluation, assessment, and review (17%). The category of faculty and staff issues (17%) mainly includes responses about the challenges of dealing with faculty and staff shortages, primarily due to budget cuts. The category of leadership and advocacy (14%) includes responses related to promoting graduate education and communicating the value of graduate education to internal and external stakeholders, among other related issues. All responses related to developing or eliminating programs were grouped as program development/elimination (9%), but the vast majority of responses in this category concerned program development rather than program elimination. Issues surrounding retention, completion, attrition, and time-to-degree (7%) are also grouped together. Finally, all responses related to program delivery, including the delivery of online, distance, interdisciplinary, and joint and dual programs are grouped as program delivery (6%).

Pressing Issues by Carnegie Classification and Institutional Control
The rank order of the top three pressing issues was the same for respondents from doctoral institutions as it was for respondents from master’s & specialized institutions (see Table 1). In both cases recruitment, admissions, and enrollment management was the top issue (65% and 74%, respectively), graduate student financial support was ranked second (54% and 52%, respectively), and graduate program financing, dealing with budget cuts, and issues related to the economy ranked third (43% and 34%, respectively). Respondents from doctoral institutions were more likely than respondents from master’s & specialized institutions to mention student support and services (32% vs. 19%), but they were less likely to mention faculty and staff issues (14% vs. 26%).
The findings for respondents from public institutions mirror the overall findings, with recruitment, admissions, and enrollment management; graduate student financial support; and graduate program financing, dealing with budget cuts, and issues related to the economy as the first, second, and third most pressing issues, respectively (see Table 1). At private, not-for-profit institutions, recruitment, admissions, and enrollment management and graduate student financial support were also the first and second most pressing issues, but the third most pressing issue was student support and services.
Pressing Issues by Geographic Region
Recruitment, admissions, and enrollment management was the top pressing issue identified by graduate deans at institutions located in all four regions of the United States (see Table 2). The percentage of respondents indicating this area as a pressing issue ranged from a low of 64% of respondents in the West to a high of 71% of respondents in the Northeast. The second and third most pressing issues varied by the geographic region of the responding institutions. Among respondents in the Northeast and South, graduate student financial support was the second most pressing issue and graduate program financing/budget/economy was the third most pressing issue. In contrast, among respondents in the Midwest and West, graduate program financing/budget/economy was the second most pressing issue and graduate student financial support was the third most pressing issue. Respondents from institutions in the Northeast and South were more likely to mention faculty and staff issues than respondents from the Midwest and West. Respondents from the Midwest and South were more likely to indicate that leadership and advocacy was a pressing issue than respondents from the Northeast and West.

Historical Comparison of Pressing Issues
Articles in previous years about the Pressing Issues Survey have provided an examination of the changes in pressing issues over time. Over the past several years, however, there have been variations in coding among researchers, as well as variations in the broad categories used to group issues, meaning that such an examination of changes over time is inexact. Rather than presenting rankings of pressing issues categories over time, it is better to simply touch on the issues that remain among the top concerns of graduate deans each year.
Two broad topics in particular have been mentioned frequently by graduate deans over the past five years: graduate student financial support and recruitment, admissions, and enrollment management. In most recent years, these have been among the two most pressing issues faced by graduate deans. Issues related to graduate program financing, dealing with budget cuts, and the economy have also been mentioned frequently by graduate deans, particularly in the last three years. General management and administration issues have also been cited as concerns in recent years, but given the wide variety of issues that are typically grouped within this category, the specific challenges have varied from year to year.
Conclusion
The results of this year’s Pressing Issues Survey reveal that the majority of graduate deans view recruitment, admissions, and enrollment management as their top concern, as they face issues related to competition for prospective graduate students, challenges in attracting a diverse applicant pool, recruiting international students, and recruiting quality graduate students, among other concerns. They also remain concerned about graduate student financial support and about graduate program financing, dealing with budget cuts, and issues related to the economy. The latter is often reflected in other broad categories as well, with respondents mentioning concerns about the effect of budget cuts and the economy on other aspects of graduate education, including recruiting budgets, personnel, and program delivery. Overall, the results of the Pressing Issues Survey reveal the continued focus of graduate deans on recruiting, enrolling, and supporting high quality graduate students; on offering high quality graduate programs that produce graduates ready to meet the demands of the 21st century global economy; and on communicating the role and value of graduate education.
By Nathan E. Bell, Director, Research and Policy Analysis
References:
Bell, N.E. 2011. Findings from the 2011 CGS International Graduate Admissions Survey, Phase I: Applications. Washington, DC: Council of Graduate Schools.
![]()