

Thank you for visiting CGS! You are currently using CGS' legacy site, which is no longer supported. For up-to-date information, including publications purchasing and meeting information, please visit cgsnet.org.
Benchmarking

CGS is the leading source of information, data analysis, and trends in graduate education. Our benchmarking data help member institutions to assess performance in key areas, make informed decisions, and develop plans that are suited to their goals.
Contact:
Belle Woods
bwoods@cgs.nche.edu
(202) 223-3791
The Council of Graduate Schools (CGS) reported today that enrollment of new students at U.S. graduate schools fell 1.1% from 2009 to 2010, compared to a 5.5% increase the previous year. This marks the first decrease in first-time graduate enrollment since fall 2003. This decline occurred despite an 8.4% increase in applications to U.S. graduate schools. Total graduate enrollment grew 1.1%.
Differences were seen in first-time enrollment of domestic students (down 1.2%) versus international students (up 4.7% after a decline last year). This is contrary to trends seen over the past decade when the average annual rate of increase for U.S. citizens and permanent residents was 4.4% vs. 2.3% for international students. According to the survey, 84% of first-time graduate students in fall 2010 were U.S. citizens and permanent residents, and 16% were temporary residents. One-quarter of all first-time graduate students were members of U.S. citizen and permanent resident racial/ethnic minority groups.
A 4.9% gain in first-time enrollment for Hispanics/Latinos between fall 2009 and fall 2010 was countered with declines for American Indians/Alaskan Natives (-20.6%), Blacks/African Americans (-8.4%), Whites (-0.6%), and Asians/Pacific Islanders (-0.1%).
“The decline in first-time enrollment, particularly across most ethnic groups, is a concern given changing demographics and the need for more students from all groups to pursue graduate degrees so that America will have the talent needed to remain competitive,” said Debra W. Stewart, CGS President. She continued, “We saw decreases in first-time graduate enrollment in broad fields such as business, education, and public administration in particular. The Bureau of Labor Statistics estimates that by 2018, 2.5 million more jobs will require advanced degrees and unfortunately, our numbers are going in the wrong direction. Strategic investments are needed now to support graduate students and the development of highly skilled talent.”
Institutions responding to the survey received nearly 1.77 million applications; the fields seeing the largest numbers of applications were business, engineering, and social and behavioral sciences.
The report presents statistics on graduate applications and enrollment for fall 2010, degrees conferred in 2009-10, and trend data for one-, five- and ten-year periods. Data are disaggregated for a number of student demographic and institutional characteristics. Other findings include:
First-time enrollment:
Total graduate enrollment:
Graduate certificates and degrees awarded:
Graduate Enrollment and Degrees: 2000 to 2010 presents the findings of an annual survey of U.S. graduate schools, co-sponsored by CGS and the Graduate Record Examinations (GRE) Board. It is the only annual national survey that covers enrollment in all fields of graduate study and is the only source of national data on graduate applications. The report includes responses from 655 institutions, which collectively confer about 75% of the master’s degrees and 88% of the doctorates awarded each year.
The Council of Graduate Schools (CGS) is an organization of over 500 institutions of higher education in the United States and Canada engaged in graduate education, research, and the preparation of candidates for advanced degrees. Among U.S. institutions, CGS members award 92% of the doctoral degrees and 77% of the master’s degrees.* The organization’s mission is to improve and advance graduate education, which it accomplishes through advocacy in the federal policy arena, research, and the development and dissemination of best practices.
* Based on data from the 2010 CGS/GRE Survey of Graduate Enrollment and Degrees
Data Sources: Preliminary Data Indicate Slight Drop in Domestic First-Time Graduate Enrollment
December 2011
This article examines first-time graduate enrollment of U.S. citizens and permanent residents in fall 2011.
Data Sources: International Comparisons of Educational Attainment
November 2011
This article uses data from Education at a Glance to examine educational attainment across OECD and G‐20 countries.
Data Sources: Trends in First-Time Graduate Enrollment in Education Programs
October 2011
This article examines the decline in first‐time graduate enrollment that occurred in education in fall 2010, exploring variations by field of study, attendance status, race/ethnicity, degree level, and gender.
Data Sources: Domestic Applications and Offers of Admission Dip for Fall 2011
August/September 2011
This article presents an analysis of U.S. citizen and permanent resident graduate applications and offers of admission for fall 2011.
Enrollment and Degrees in Professional Science Master’s (PSM) Programs: 2010
August 2011
The 2010 Professional Science Master’s Enrollment and Degrees Survey is an annual survey of enrollment and degrees in Professional Science Master’s (PSM) programs. Previous PSM enrollment and degrees surveys were conducted for academic years 2008 and 2009 by NPSMA, the National Professional Science Master’s Association. The revamped 2010 survey was carried out by CGS with a grant from the Alfred P. Sloan Foundation. It collected data regarding applications, first-time enrollment, total enrollment, and degrees awarded.
Outcomes for PSM Alumni: 2010/11
August 2011
The 2011 Professional Science Master’s (PSM) Student Outcomes Survey was conducted by the Council of Graduate Schools with a grant from the Alfred P. Sloan Foundation. The survey was designed to capture initial hiring outcomes of PSM graduates and follow them for up to five years after graduation. The design was based upon a review of more than 40 outcomes-related data collection efforts from more than 30 governmental agencies, non-profit organizations, and educational institutions. A draft version of the questionnaire was reviewed by numerous individuals affiliated with the PSM initiative, including members of the Board of Directors of the National Professional Science Master’s Association (NPSMA) and members of the Council of Graduate Schools PSM Advisory Board.
Data Sources: Graduate Students with Disabilities
July 2011
This article provides data on the participation of individuals with disabilities in graduate education.
Data Sources: Trends in Applications and Financial Support Deadlines
June 2011
This article presents a brief analysis of the responses to questions in the 2011 CGS International Graduate Admissions Survey about application and financial support deadlines for graduate students.
Data Sources: Results from the 2011 CGS Pressing Issues Survey
May 2011
Each year, CGS asks graduate deans at member institutions to identify the three most important or “pressing” issues or challenges they currently face. This article summarizes the results of the 2011 CGS Pressing Issues Survey.
Data Sources: Graduate Enrollment and Degrees—U.S. and Canadian Comparisons
April 2011
While differing definitions and methodologies prevent exact comparisons, this article examines data from CGS and the Canadian Association for Graduate Studies to illuminate the similarities and differences in the graduate student populations of the U.S. and Canada.
Data Sources: Higher Education Continues to Lead to Higher Earning, but Disparities Remain
March 2011
Using data from the Bureau of Labor Statistics, this article examines earnings by level of educational attainment.
Data Sources: Graduate Enrollment at Hispanic-Serving Institutions
January/February 2011
This article examines graduate enrollment at institutions classified as Hispanic-serving Institutions.
Contact:
Belle Woods
bwoods@cgs.nche.edu
(202) 223-3791
The Council of Graduate Schools (CGS) is reporting today that there was an increase of 8% in first-time enrollment of international students at U.S. graduate schools from 2010 to 2011. This increase builds on last year’s growth of 3%. The gain is the largest since 2006, when international first-time graduate enrollment increased 12%.
Fifty-seven percent of the institutions that responded to the survey reported an increase in international first-time enrollment, with an average increase of 15%; for those 92 institutions reporting a decrease, the average decline was 14%. Total enrollment of international graduate students rose 2%, compared to 1% in 2010 and 2% in 2009. (First-time and total enrollment trends differ due to the varying length of time required to complete graduate degrees, particularly doctorates.)
First-time enrollment changes vary considerably by country of origin. First-time enrollment of students from China, the country that sends the most graduate students to the U.S., increased by 21%, and the Middle East saw 14% growth. There was 2% growth in the number of students enrolling for the first-time from India, the second largest sending country, following a 3% drop last year and a 16% decline in 2009. First-time graduate enrollment of students from South Korea remained flat in 2011 after a 3% drop in 2010 and a 13% decline in 2009.
“This surge in new student enrollments tracks well with the increases in applications and offers of admission seen earlier this year,” said Debra W. Stewart, CGS President. “In order to remain the first-choice for the best and brightest students from around the world, the U.S. must maintain our investments in graduate education and our outreach to prospective international students,” she added.
Enrollment trends by field of study and institution type
The changes in international first-time graduate enrollment vary by field of study and institution type. The largest gains were seen in education and physical & earth sciences (both 12%). The increase in education was particularly strong after a decrease of 7% last year. Business (9%) and ‘other fields’ (8%) also saw strong growth, and engineering grew 6%, while life sciences saw the smallest growth of 1%.
The survey also reports changes based on the number of graduate degrees granted to international students by institutions. Overall, the schools that award the largest number of degrees to international students were more likely to see an increase in international first-time graduate enrollment. There was 9% growth at the institutions granting the largest number of degrees, compared to a 4% increase at schools that award fewer degrees to international students.
Similar to years past, the increase in first-time international enrollment this year was driven primarily by doctoral institutions which enroll more international students than master’s-focused institutions. Doctoral institutions saw first-time enrollment growth of 8% while master’s-focused institutions saw a drop of 5% for the second year in a row.
There were increases in first-time graduate enrollment of international students by geographic region as well; the Northeast saw a 10% increase, the Midwest grew 8% and the West and South both saw 7% increases.
About the report
Findings from the 2011 CGS International Graduate Admissions Survey, Phase III: Final Offers of Admissions and Enrollment is based on the final phase of a three-part annual survey of international graduate student applications, admissions, and enrollment among CGS U.S. member institutions. The survey had a response rate of 48%, including 75 of the 100 institutions that grant the largest numbers of graduate degrees to international students.
The report is available at: http://cgsnet.org/ckfinder/userfiles/files/R_IntlEnrl11_III.pdf
The Council of Graduate Schools (CGS) is an organization of over 500 institutions of higher education in the United States and Canada engaged in graduate education, research, and the preparation of candidates for advanced degrees. Among U.S. institutions, CGS members award 92% of the doctoral degrees and 77% of the master’s degrees.* The organization’s mission is to improve and advance graduate education, which it accomplishes through advocacy in the federal policy arena, research, and the development and dissemination of best practices.
* Based on data from the 2010 CGS/GRE Survey of Graduate Enrollment and Degrees
Contact:
Belle Woods
bwoods@cgs.nche.edu
(202) 223-3791
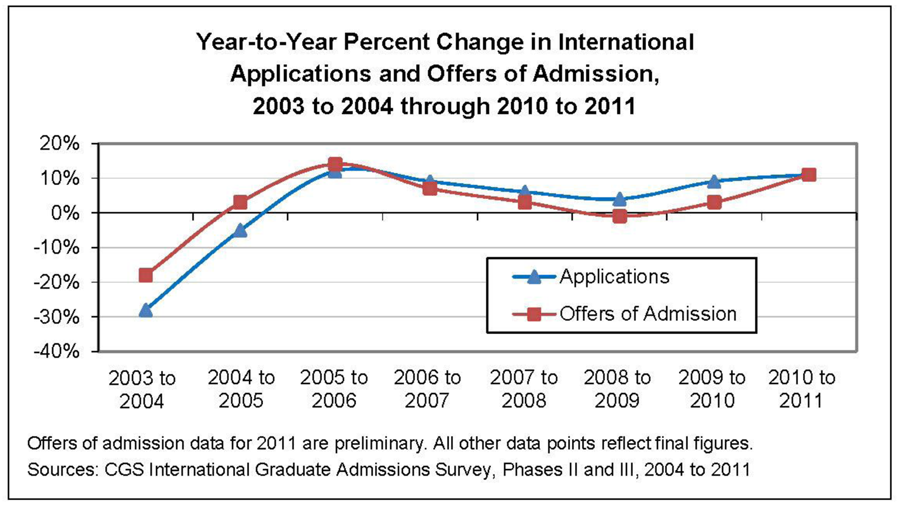
The Council of Graduate Schools (CGS) is reporting that offers of admission from U.S. graduate schools to prospective international students increased 11% from 2010 to 2011 after an increase of 3% last year. The 11% gain is the largest increase in offers of admission since 2006.
The survey report on admissions trends, released today, shows that the growth was driven substantially by a 23% increase in offers of admission to prospective students from China, the sixth year in a row of double-digit gains. Offers of admission to students from the Middle East and Turkey rose 16%, the fourth consecutive year of significant growth. Students from India saw an 8% increase, the first gain since 2007, and offers of admission to prospective South Korean students remained flat after four consecutive years of declines.
“While the growth in admissions is driven in large part by increases from China, it also reflects a broader trend as evidenced by strong numbers from the Middle East and India and a stabilization in the numbers from South Korea,” said Debra W. Stewart, CGS President. “This kind of strong growth in international student applications and admissions is a real testament to the quality of our graduate institutions in an increasingly competitive marketplace,” she added.
Large institutions (in terms of the number of graduate degrees awarded to international students) continue to drive more of the growth in international offers of admission than those awarding smaller numbers of graduate degrees to international students. Respondents from the larger institutions showed slightly stronger increases: 13% at the 10 largest, 12% at the 100 largest, and 10% at the institutions outside the largest 100.
Admissions trends by field and institution type
The changes in offers of admission to prospective international students vary by field of study and institution type. Admissions increased in all eight broad fields. The largest increases were
seen in business (16%) and physical & earth sciences (15%) while social sciences & psychology saw the smallest increase at 3%. Offers of admission increased at nearly the same rate at both private, not-for-profit institutions (12%) and public institutions (11%).
Admissions trends by region
Offers of admission by U.S. graduate schools to prospective international students increased in all four major regions of the United States this year. The West saw the most growth (13%), the South and Midwest both increased 11%, and the Northeast grew 10%.
Comparison of Applications and Admissions trends
In addition to admissions trends, the report also tracks applications; this year the increases in applications were similar to gains in offers of admission. The survey found a final 11% increase in international graduate applications for fall 2011, with large increases in applications from China (21%) and the Middle East and Turkey (16%), along with India (8%). Applications from South Korea grew 2% after remaining flat in 2010.
Findings from the 2011 CGS International Graduate Admissions Survey, Phase II: Final Applications and Initial Offers of Admission is based on the second phase of a three-part annual survey of international graduate student applications, admissions, and enrollment among CGS U.S. member institutions. The survey had a response rate of 49%, including 79 of the 100 institutions that award the largest number of graduate degrees to international students.
The Council of Graduate Schools (CGS) is an organization of over 500 institutions of higher education in the United States and Canada engaged in graduate education, research, and the preparation of candidates for advanced degrees. Among U.S. institutions, CGS members award 93% of the doctoral degrees and 76% of the master’s degrees.* The organization’s mission is to improve and advance graduate education, which it accomplishes through advocacy in the federal policy arena, research, and the development and dissemination of best practices.
* Based on data from the 2009 CGS/GRE Survey of Graduate Enrollment and Degrees
Data Sources: International Enrollment in U.S. Graduate Schools
December 2008
Summary findings from the 2008 CGS International Graduate Admissions Survey for first-time and total enrollment are presented in this article, with a special analysis of the data by institutional control (public versus private).
Data Sources: Enrollment and Degree Trends in Graduate Education, Medicine, and Law
November 2008
This article compares statistics from the CGS/GRE Enrollment and Degrees Survey and graduate education data from the National Center for Education Statistics (NCES) and the National Science Foundation (NSF), with medical education statistics from the Association of American Medical Colleges (AAMC), and legal education statistics from the American Bar Association (ABA).
Data Sources: International Graduate Programs–2007 & 2008
October 2008
This article looks at the many collaborative graduate education programs that U.S. universities have established with international higher education institutions.
Data Sources: Preliminary Results of the 2007 Graduate Enrollment and Degrees Survey
July 2008
This article provides a summary of the enrollment and degrees data from the 2007 CGS/GRE Survey of Graduate Enrollment and Degrees.
Data Sources: Graduate Students in Distance Education, 2003-2004
June 2008
Distance education is generally defined as the delivery of courses, academic training, or academic materials by use of live, interactive television or audio, pre-recorded television or video, CD-ROM, or computer-based systems such as the Internet. This article analyzes trends in graduate distance education over time.
Data Sources: Aspirations to Graduate School
May 2008
This article examines differences in aspirations to graduate school by race/ethnicity.
Data Sources: Results from CGS Pressing Issues Survey
April 2008
Each year, CGS asks graduate deans at member institutions to identify the three most important or “pressing” issues or challenges they currently face. This article summarizes the results of the 2008 CGS Pressing Issues Survey.
March 2008
This article examines the role of Historically Black Colleges and Universities (HBCUs) in increasing the number of African American doctoral degree holders.
January 2008
This article examines graduate enrollment by race and ethnicity based on data from the 2007 CGS/GRE Survey of Graduate Enrollment and Degrees.
Data Sources: Non-Traditional Students in Graduate Education
December 2009
This article uses three data sources to explore changes in the participation of older students in graduate education over time.
Data Sources: Graduate Student Loan Debt
November 2009
This article examines graduate student loan debt by gender, race/ethnicity, and field, using data from the National Postsecondary Student Aid Study (NPSAS), a sample survey conducted by the National Center for Education Statistics.
Data Sources: Graduate Education at For-Profit Institutions
August/September 2009
This article explores the growth in the number of for-profit institutions in the United States, as well as the trends in graduate enrollment and degrees at these institutions.
Data Sources: Graduate Degree Attainment of the U.S. Population
July 2009
This article examines graduate degree attainment rates of individuals in the United States, using data from the Current Population Survey.
Data Sources: How Graduate Students Finance their Education
June 2009
With the cost of graduate education rising and university budgets tightening, this article seeks to understand how graduate students finance their education.
Data Sources: Results from the 2009 CGS Pressing Issues Survey
May 2009
Each year, CGS asks graduate deans at member institutions to identify the three most important or “pressing” issues or challenges they currently face. This article summarizes the results of the 2009 CGS Pressing Issues Survey.
Data Sources: GRE and GMAT Test-Taking Trends
April 2009
In this article, CGS focuses on recent trends in GRE and GMAT test-taking volumes and on the demographics of GRE and GMAT test-takers.
Data Sources: Recent Trends in Employment and Unemployment among Doctoral Scientists and Engineers
January/February 2009
This article looks at recent trends in employment and unemployment among doctoral scientists and engineers.
Contact:
Belle Woods
bwoods@cgs.nche.edu
(202) 223-3791
The Council of Graduate Schools (CGS) is reporting that the number of applications from prospective international students to U.S. graduate schools increased in 2011 for the sixth consecutive year; the 9% growth matches the gain in 2010.
The initial snapshot of graduate applications for fall 2011, released today, shows a sixth successive year of double-digit growth in applications from China, up 18%, after a 20% gain in 2010. Applications from India and South Korea showed renewed growth this year; there was a 2% increase in applications from South Korean students compared to no growth last year, and a 7% growth in applications from India after a 1% gain in 2010. China, India, and South Korea are the three largest countries of origin for international graduate students in the U.S. The Middle East and Turkey saw an increase of 12% in 2011 which is lower than the previous year’s growth rate of 20%.
About three-quarters (72%) of institutions reported an increase in applications over last year, with an average increase of 11% at these institutions. The remaining institutions reported a decrease, averaging 9%.
“This year’s growth in applications from all four of the countries and regions we survey is a positive sign,” said CGS President Debra W. Stewart. “The data show that U.S. graduate schools continue to be highly attractive to international students. Yet it would be unwise to take our current position for granted, since international students have a growing number of choices in the global education marketplace.” she added.
Application trends by field of study
Applications increased in all broad fields though the increases varied between fields. Engineering and physical & earth sciences saw a 12% increase in international applications while “other fields” increased by 13% following an equal increase last year. Education increased 9%, followed closely by arts & humanities and the life sciences, both at 8%. This year’s 8% increase in life sciences is the largest gain in the field since 2007. Social sciences & psychology saw a smaller increase of 5%, compared to an 11% increase last year. The field which saw the smallest growth was business (4%), down from last year’s increase of 11%.
Application trends by institutional characteristics
CGS also analyzes changes in international applications by various institutional characteristics. As in 2010, growth this year was slightly stronger at institutions that award the largest number of degrees to international students. This pattern was particularly pronounced for applications from prospective Chinese students: applications from China surged 26% at the 10 largest schools, but grew just 12% at those responding schools outside the 100 largest.
A 4% decline in international applications occurred in the field of business at the 25 institutions that award the largest numbers of graduate degrees to international students. This is of particular note because the 100 largest institutions combined experienced only a 1% growth on average in international applications in business, compared to a 13% gain at the institutions outside the largest 100. Dr. Stewart noted, “This may be a reflection of the growing competition in high quality graduate business programs worldwide.”
A slight difference emerged between private and public institutions. Applications increased 11% at private, not-for-profit schools, and 9% at public graduate schools; last year, the difference in growth was more pronounced (12% vs. 7%).
Application trends by region
Applications from international students increased in all regions of the U.S. The increase was largest in the West (13%) and Midwest (10%) while the Northeast (8%) and the South (7%) saw smaller gains.
Findings from the 2011 CGS International Graduate Admissions Survey, Phase I: Applications is based on the first phase of a three-part annual survey of international graduate student applications, admissions, and enrollment among CGS U.S. member institutions. The analysis includes responses from 230 schools, including 84% of the 50 institutions which award the largest number of degrees to international graduate student; the respondents award over 60% of the degrees granted to international graduate students in the U.S. The report is available at www.cgsnet.org.
The Council of Graduate Schools (CGS) is an organization of over 500 institutions of higher education in the United States and Canada engaged in graduate education, research, and the preparation of candidates for advanced degrees. Among U.S. institutions, CGS members award 93% of the doctoral degrees and 76% of the master’s degrees.* The organization’s mission is to improve and advance graduate education, which it accomplishes through advocacy in the federal policy arena, research, and the development and dissemination of best practices.
* Based on data from the 2009 CGS/GRE Survey of Graduate Enrollment and Degrees
![]()