

Thank you for visiting CGS! You are currently using CGS' legacy site, which is no longer supported. For up-to-date information, including publications purchasing and meeting information, please visit cgsnet.org.
Benchmarking

CGS is the leading source of information, data analysis, and trends in graduate education. Our benchmarking data help member institutions to assess performance in key areas, make informed decisions, and develop plans that are suited to their goals.
Hironao Okahana, Associate Vice President, Research & Policy Analysis, Council of Graduate Schools
The latest national data suggest that increasingly more former Pell recipients—thus, students from low-income backgrounds—are pursuing graduate and professional programs. However, the data also suggest that many of them begin their advanced education with sizeable undergraduate debt and continue to rely on student loans to finance their education. Graduate schools should proactively help these students make informed financial aid decisions and manage and reduce their borrowing and debt.
Introduction
The sociodemographic diversity of the graduate student body has evolved over time. Though still disproportionally underrepresented, we reported in the CGS/GRE Survey of Graduate Enrollment & Degrees that first-time enrollment of traditionally underserved students of color continues to grow. Graduate schools continue to make efforts to ensure a more diverse and inclusive student body through a number of initiatives. Another indicator of sociodemographic diversity in higher education is the Pell ratio, that is, the proportion of the student body who receives Pell Grants. This indicator is commonly used to assess sociodemographic diversity of undergraduates since the Pell Grant has income requirements and is specifically targeted to low-income students. Because graduate students are not eligible for Pell Grants, typically we do not closely observe this figure. Nevertheless, looking at proportions of former Pell recipients among graduate students can offer additional insight into the accessibility of graduate education for those from low-income backgrounds.
In May 2018, the National Center for Education Statistics (NCES) released the PowerStats version of the 2015-16 National Postsecondary Student Aid Study (NPSAS:16). PowerStats is an online tool that allows researchers to generate data tables and some analyses using various NCES sample surveys, including NPSAS. NPSAS is a nationally representative sample study of financial support for all students at U.S. institutions of higher education. NCES conducts this study every three to four years, and the most recent one, NPSAS:16, captures one of the most comprehensive looks at how undergraduate and graduate students were financially supported during the Academic Year 2015-16. As points of comparison, I also looked at two earlier cohorts: NPSAS:08 and NPSAS:12, which respectively offer snapshots of students in Academic Years 2007-08 and 2011-12.
More Former Pell Recipients at Graduate and Professional Schools
Table 1 summarizes the percentage shares of former Pell recipients among first-year graduate and professional students by selected degree programs. According to NPSAS:16, 45.8% of first-year graduate and professional students received Pell Grants at some point. This is an increase from a little under one-third (32.5%) for the NPSAS:08 cohort and 35.9% for the NPSAS:12 cohort. In all types of graduate and professional programs, the shares for former Pell recipients among first-year students increased when compared to NPSAS:08 and NPSAS:16 cohorts. The shares of former Pell recipients among first-year students in the NPSAS:16 cohort were particularly high in master of public administration or policy (64.2%), master of social work (63.3%), and master of education or teaching (54.5%) programs. Of the first-year students in doctor of philosophy and doctoral degree – professional practice (e.g., MD, JD, DDS, etc.) programs, 41.7% and 39.8%, respectively, were former Pell recipients in the NPSAS:16 cohort. These changes are encouraging signs that the increasing number of students from low-income backgrounds are moving beyond baccalaureate education and pursuing graduate and professional degrees.

Former Pell Recipients Are More Likely to Take out Student Loans
However, the data, which are summarized in Table 2, also suggest that these former Pell recipients among first-year graduate and professional students come with greater financial needs for their advanced education than their counterparts. Among the first-year students in the NPSAS:16 cohort enrolled in various graduate and professional programs, 69.7% of former Pell recipients took out student loans during the 2015-16 academic year. 37.6% of students who never received Pell Grant borrowed toward their advanced education in the same year. The discrepancy was the largest for first-year students in Master of Arts (MA) degree programs. Nearly three-fourths (73%) of former Pell recipients among those MA students took out student loans during the 2015-16 academic year, while only 29.3% of non-former Pell recipients did the same. The median amount borrowed by former Pell recipients who were first-year students in MA degree programs was $18,444, while the median amount borrowed by their counterparts without Pell Grant debt was $13,195. The difference in amount borrowed between former Pell recipients and non-recipients was the smallest among first-year students in doctoral degree – professional practice (e.g., MD, JD, DDS, etc.) programs. Among those who were pursuing doctoral degrees – professional practice, the median amount borrowed by former Pell recipients was $39,106 while the median amount borrowed by non-former Pell recipients was $35,000.

Bigger “Baggage” of Former Pell Recipients
Even before borrowing for their advanced education, as summarized in Table 3, these former Pell recipients arrive at graduate and professional schools with larger amounts of undergraduate debt. More than three quarters (77.2%) of first-year master’s students who formerly received Pell Grants carried outstanding balances from their undergraduate loans, with the median amount of $28,131. This is compared to only 31.2% of their counterparts who never received Pell Grants carrying outstanding balances for their undergraduate debt. Furthermore, the median amount still owed for the latter group was substantially smaller at $18,964. Median amounts still owed on undergraduate debts exceeded $30,000 for first-year students in master of social work ($33,658), master of business administration ($33,352), master of arts ($31,584), and doctor of philosophy ($30,228) programs. Students can defer repayment of their federal student loans while pursuing advanced degrees; however, unsubsidized portions of loans still accrue interest during deferment. The debts former Pell recipients carry over from their undergraduate education, compounded by potential unmet financial needs toward their graduate and professional education, could prevent them from fully realizing the upward social mobility often associated with attaining advanced degrees.

Discussion
An increasing number of former Pell recipients entering graduate and professional programs is a welcome sign. However, it is clear many of these students arrive to graduate school with sizeable undergraduate debt. At the federal-level, the vast majority of financial aid for graduate and professional students comes in the form of loans. Absent federal need-based grants for graduate and professional students that mirror the Pell Grant program for undergraduates, it is no surprise that former Pell recipients are more likely to borrow for their advanced education. Simply limiting the ability of graduate and professional students to borrow would take away one of few aid options for students with the most financial need. What we should encourage, instead, is more informed decisions.
Graduate students need to be aware of how their undergraduate and graduate debts interact with one another, and how to manage both while in school and upon completing their degrees. Thus, CGS advocates at the federal-level for establishing procedures that support master’s and doctoral students in making informed financial aid decisions to reduce their borrowing and debt. Graduate schools, too, can play a role in preparing students to actively manage their personal finances and make informed decisions about saving, spending, and borrowing.
However, debt management alone can only go so far in ensuring access and affordability of graduate education for students from low-income backgrounds. Thus, CGS advocates for extending Pell eligibility to those graduate students who remain income eligible and did not exhaust 12 semesters of Pell while pursuing their undergraduate education. In the NPSAS:16 cohort, only 6.5% of domestic graduate students have received Pell Grants for six years or more. What we advocate would allow the 34.6% who did not use all 12 semesters of Pell Grants to apply their remaining semesters toward their graduate education, as long as they also remain income eligible. This is one way to alleviate their borrowing toward graduate education, thus reducing overall education debts.
Career Pathways Brief: Preparing Future Faculty for All Types of Colleges and Universities
December 2018
According to the National Science Foundation’s (NSF) National Survey of College Graduates, 49% of doctoral degree holders employed in 2015 worked for colleges and universities in some capacity. For over two-thirds of the PhDs employed by colleges and universities, teaching is their primary or secondary work activity. In fact, 43.8% of the postsecondary teaching workforce, including those employed at community colleges, hold a doctoral degree (U.S. Bureau of Labor Statistics, 2018). Though the vast majority of research doctorates are conferred by Doctoral Universities, these institutions only make up 7.1% (311 of 4,360) of degree-granting postsecondary institutions in the United States (National Center for Education Statistics [NCES], 2018a) and enroll just over one-quarter of the approximately 20 million undergraduate students (NCES, 2018b). Using survey data from the Council of Graduate Schools’ (CGS) PhD Career Pathways project, this brief provides new insight into how PhDs feel about their preparation to work at different types of institutions.
Career Pathways Brief: How Well Did a Humanities PhD Prepare Them?
October 2018
The vast majority of humanities PhDs still work in felds related to their doctoral education and are satisfed with their jobs. According to the National Survey of College Graduates by the National Science Foundation (NSF), 92% of humanities PhDs working in 2015 held jobs that are closely or somewhat related to their PhDs. Furthermore, 85% of humanities PhDs who are employed are satisfed or very satisfed with their current work. This percentage is consistent for the 92% who work in related felds as well as the 8% who work in felds unrelated to their humanities PhD degrees (NSF, n.d.). Though these national data tell us about humanities PhDs in the workforce and their satisfaction with their current jobs, little is known about their views on their PhD training. Using survey data from the Council of Graduate Schools’ (CGS) PhD Career Pathways project, this brief provides new insight into how humanities PhDs apply their doctoral training in the workforce.
CGS Research in Brief: Trends in International First-time Graduate Enrollment
October 2018
According to the 2018 CGS/GRE Survey of Graduate Enrollment and Degrees (GE&D), first-time graduate enrollment of international students at participating institutions declined by 3.7% between Fall 2016 and Fall 2017. This brief highlights some additional analysis pertaining to international graduate enrollment trends.
Data Sources: Increasing Number of Graduate and Professional Students Are Former Pell Recipients
July 2018
The latest national data suggest that increasingly more former Pell recipients—thus, students from low-income backgrounds—are pursuing graduate and professional programs. However, the data also suggest that many of them begin their advanced education with sizeable undergraduate debt and continue to rely on student loans to finance their education. Graduate schools should proactively help these students make informed financial aid decisions and manage and reduce their borrowing and debt.
Pressing Issue: Mental Wellness of Graduate Students
April 2018
A number of recent studies have drawn attention to the mental health challenges experienced by graduate students. Studies note that the prevalence of mental health challenges among PhD students is higher than that of the highly-educated general population, and much higher than in the general population. The most recent study published in Nature Biotechnology reported that 39% of their participants, mostly doctoral candidates, fell into the moderate-to-severe depression range, while other studies reported that one in two PhD students has experienced psychological distress, and one in three is at risk of a common psychiatric disorder. Some factors known to adversely affect the mental wellness of graduate students have also been noted in CGS’s recently concluded “Doctoral Initiative on Minority Attrition and Completion (National Science Foundation grant number 1138814)” project. In that study, we found that underrepresented minority doctoral candidates in science, technology, engineering, and mathematics fields were more likely to feel isolated from other students and worried about their mental or physical health than their peers.
How America Pays for Graduate School
March 7, 2018
This is the first edition of “How America Pays for Graduate School” and is a follow up to “How America Pays for College”, which was recently published for the 10th consecutive year. The study surveyed 1,597 graduate students on topics including: reasons for earning a graduate degree, considerations they weighed when deciding to attend graduate school, as well as how much they spent on graduate school and how they funded their education. As always, followed by formal remarks, we will welcome lively discussion from the audience.
The Butler Didn't Do It-Looking Beyond the Usual Suspects in Understanding Doctoral Success
June 27, 2018
In graduate education, we have constructed very stable narratives about the factors that influence students success. However, careful analysis of empirical studies tells a different, more nuanced story. The qualities of faculty mentors don't necessarily drive student development and attainment. Initial advantages in skill or cultural capital don't lead to a "rich get richer" story through the mechanisms we suppose. Intervening early isn't always beneficial. Recently published psychological and sociological data hold implications for ways to shape PhD policies and programs to maximize the benefit to students as they develop skills and position themselves to enter the workforce.
Hironao Okahana, Associate Vice President, Research & Policy Analysis
A number of recent studies have drawn attention to the mental health challenges experienced by graduate students.[1] Studies note that the prevalence of mental health challenges among PhD students is higher than that of the highly-educated general population, and much higher than in the general population.[2] The most recent study published in Nature Biotechnology reported that 39% of their participants, mostly doctoral candidates, fell into the moderate-to-severe depression range,[3] while other studies reported that one in two PhD students has experienced psychological distress, and one in three is at risk of a common psychiatric disorder.[4] Some factors known to adversely affect the mental wellness of graduate students have also been noted in CGS’s recently concluded “Doctoral Initiative on Minority Attrition and Completion (National Science Foundation grant number 1138814)” project. In that study, we found that underrepresented minority doctoral candidates in science, technology, engineering, and mathematics fields were more likely to feel isolated from other students and worried about their mental or physical health than their peers[5].
The challenges surrounding mental wellness of master’s and doctoral students are at the forefront of the minds of many graduate deans in the CGS community. In the 2018 CGS Pressing Issues Survey[6], 63% of respondents strongly agreed or agreed that current graduate students struggle to maintain mental wellness more than students five years ago. Only 10% of respondents disagreed with the statement and none strongly disagreed. However, even with this heightened awareness about mental health challenges among graduate students, graduate deans also seem concerned that campus stakeholders may not currently be equipped to address these challenges.
Identifying Mental Health Challenges
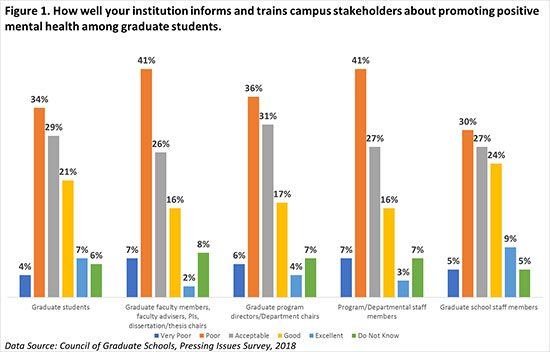
When asked how well their institutions inform and train various campus stakeholders to recognize symptoms of mental health challenges in graduate students and in turn refer those students to appropriate support services, many graduate deans who responded expressed concern that their institutions weren’t doing enough. Notably, the results suggest that more than four out of ten graduate deans think that more can be done to inform and train graduate faculty members, faculty advisers, PIs, and dissertation/thesis chairs, as well as graduate program directors/department chairs and graduate students themselves. Only 21% of deans reported that their institutions do an excellent or good job of informing and training graduate faculty members. About one out of ten respondents (11%) reported that they do not know if graduate students are informed or trained about symptoms of mental health issues.
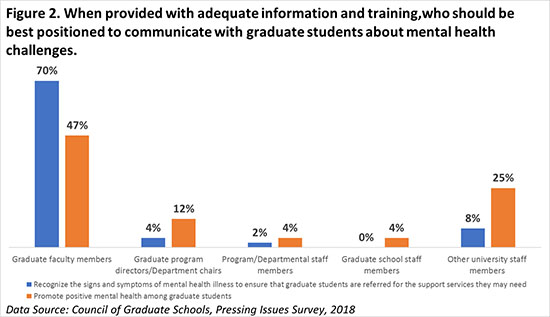
However, we also learned that support services for mental health are available at institutions. In the 2017 CGS Pressing Issues Survey[7], 96% of CGS member graduate deans who responded indicated that mental health support and crisis counseling are provided either by their graduate schools and/or by other units at their institutions. Yet, the results from the 2018 survey suggest that institutions are not doing as well at informing and training graduate school stakeholders to recognize and refer students with mental health challenges to the appropriate and available resources at their campuses. This is problematic, particularly given that 70% of graduate deans in the 2018 survey felt that when provided with adequate information and training, graduate faculty members—including faculty advisers, PIs, and dissertation/thesis chairs—should be best positioned to recognize the signs and symptoms of mental health challenges and ensure that graduate students are referred to appropriate support services. Graduate schools may have a role here in better connecting graduate students with available resources through their graduate faculty members.
Promoting Mental Wellness
Of the graduate deans who responded to the survey, 33% reported that their institutions are doing a good or excellent job of training and informing graduate school staff members to promote positive mental health among graduate students. However, many graduate deans also felt that institutions are not doing enough to inform and train various graduate education stakeholder groups to promote positive mental health among graduate students. Notably, nearly half of responding graduate deans indicated that their institutions are doing a poor or very poor job of informing and training graduate faculty members, faculty advisers, PIs, and dissertation/thesis chairs. This is another area in which graduate schools have the potential to engage more graduate faculty members to promote positive mental health among graduate students: 47% of graduate deans also felt that when provided with adequate information and training, graduate faculty members should be best positioned to promote positive mental health among graduate students.
Moving the Conversation Forward
Graduate student mental wellness is a key area of priority for the graduate education community and CGS is committed to advancing the national conversation. At the 2017 CGS Annual Meeting, we held a concurrent session on Supporting Students With Mental Health Challenges, and at the upcoming CGS Summer Workshop in Chicago this July, Mona Shattell, chair and professor in the College of Nursing at Rush University, will give a plenary talk on supporting graduate student health and wellness. Also at the Summer Workshop, there will be a Dean’s Toolbox session about evidence-based strategies for supporting graduate student well-being and success, using an example from Texas A&M University. We encourage you to be there and to be a part of this important conversation.
CGS is also beginning to formulate a series of projects and initiatives that aim to facilitate culture change in academia and to destigmatize mental health support-seeking, while promoting mental wellness among master’s and doctoral students. As a first step toward this goal, we are preparing a white paper that addresses some of the foundational questions about trends in graduate student mental health challenges and ways for graduate schools and graduate school leaders to play more integral roles in promoting the mental wellness of master’s and doctoral students. As we draft this paper, which we will share with CGS members, we will explore examples of currently available resources and will reach out to member deans for insights. While we will conduct a scan of the landscape of both extant literature and institutional practices, it is also helpful to crowdsource some of the cutting-edge ideas among our member institutions. If you have any promising approaches, new initiatives, and insights in promoting mental wellness among master’s and doctoral students, we invite you to share them with us.
[1] Flaherty, C. (2018, March 6). Mental Health Crisis for Grad Students. Retrieved from https://www.insidehighered.com/news/2018/03/06/new-study-says-graduate-students-mental-health-crisis.
[2] Evans, TM., Bira, L., Gastelum, GB., Weiss, LT., and Vanderford, NL. (2018). Evidence for a Mental Health Crisis in Graduate Education. Nature Biotechnology, 36(3): 282-284, as well as Table 4 in Levecque, Anseel, De Beuckelaer (2017). Levecque, K., Anseel, F., De Beuckelaer, A., Van der Heyden, J., & Gisle, L. (2017). Work organization and mental health problems in PhD students. Research Policy, 46(4), 868–879. doi:10.1016/j.respol.2017.02.008. For reference, 1 in 5 American adults experience mental illness in any given year. (https://www.nimh.nih.gov/health/statistics/prevalence/any-mental-illness-ami-among-us-adults.shtml)
[3] Evans, TM., Bira, L., Gastelum, GB., Weiss, LT., and Vanderford, NL. (2018). Evidence for a Mental Health Crisis in Graduate Education. Nature Biotechnology, 36(3): 282-284.
[4] Eisenberg, D., Hunt, J., & Speer, N. (2013). Mental health in American colleges and universities. Journal of Nervous and Mental Disease, 201(1), 60–67. doi:10.1097/nmd.0b013e31827ab077; Hyun, J.K., Quinn, B.C., Madon, T. & Lustig, S. (2006). Graduate student mental health: Needs assessment and utilization of counseling services. Journal of College Student Development, 47(3): 247-266.
[5] Sowell, R., Allum, J., & Okahana, H. (2015). Doctoral Initiative on Minority Attrition & Completion. Washington, DC: Council of Graduate Schools.
[6] The 2018 CGS Pressing Issues Survey was sent to all U.S. and Canadian based CGS member institutions in February 2018, and asked graduate deans among other questions: How prevalent are mental health disorders among graduate students?; and Who is best positioned to recognize when a graduate student needs to be referred for mental health support services? In total, 204 or 42% responded to this survey.
[7] The 2017 CGS Pressing Issues Survey was sent to all U.S. and Canadian based CGS member institutions in February 2017. The survey asked a range of questions regarding priorities for graduate deans, graduate schools, and their home institutions for the upcoming twelve months, as well as observations of graduate application trends. In total, 205 or 42% responded to this survey.
The author thanks Julia Michaels, former CGS staff member, for her contribution to the literature review in this piece.
FOR IMMEDIATE RELEASE
CONTACT: Katherine Hazelrigg / khazelrigg@cgs.nche.edu / 202.461.3888
Majority of Decline in Master’s and Certificate Programs
Washington, DC —New data from the Council of Graduate Schools (CGS) reveal that for the first time since Fall 2003, international graduate application and first-time enrollment rates declined at U.S. universities. For Fall 2017, the final application counts from prospective international students declined by 3%, while the first-time enrollment of international graduate students declined by 1%.
The overall decline is primarily in master’s and certificate programs, with responding institutions reporting a 4.8% decrease in applications and a 2.8% decrease in first-time enrollment. In contrast, first-time international doctoral enrollment grew by 1.8%. Given that 77% of first-time international graduate enrollment was in master’s and certificate programs and 23% was in doctoral programs, the discrepancy by degree objective is notable.
Recent changes in immigration policy, including the executive order barring entry or return of U.S. visa holders from specific countries, are being closely watched by members of the graduate education community. While students directly affected by the ban constitute a relatively small percentage of international graduate students, there has been significant concern that new immigration policies will tarnish the U.S.’s image as a welcoming destination for international students and scholars.
CGS President Suzanne Ortega noted, “While the declines we see this year are concerning, the good news is that the application acceptance rates and admission yield rates are comparable to last year. This suggests that prospective international graduate students remain highly likely to accept offers of admission to U.S. graduate schools. This may be due to increased efforts on the part of graduate schools and universities to assure international students that they will be welcomed and supported.”
Application and enrollment numbers saw wide variations by sending country. The 2016-2017 admissions cycle marks the second year in a row that applications and first-time enrollment of international graduate students from the Middle East and North Africa declined. In aggregate, responding institutions reported a greater decline in applications between Fall 2016 and Fall 2017 (-17%) than was seen in the prior admission cycle (-5%). However, first-time graduate enrollment declined at a slower rate (-5%) compared to the prior year (-11%). Iran and Saudi Arabia historically represent the largest share of international graduate students from the Middle East and North Africa region, and applications from the two countries dropped by 18% and 21% respectively.
China and India continue to represent the largest shares of international graduate applications, first-time international graduate enrollment, and total international graduate enrollment. However, the final application and first-time graduate enrollment of Indian students decreased (-15%, -13% respectively) during the Fall 2016 to Fall 2017 admission cycle. This is the first decline in applications from India since Fall 2012.
Application counts for prospective European graduate students to U.S. institutions grew by 18%. However, first-time enrollment of European graduate students at U.S. institutions in Fall 2017 only increased by 1%. In Fall 2016, first-time enrollment rates for European graduate students rose by 8%.
The report also includes data trends by field of study. By total application and first-time enrollment counts, the most popular fields of study continue to be Business (15% and 19% respectively), Engineering (28% and 26% respectively), and Mathematics and Computer Sciences (22% and 19% respectively). By contrast, U.S. institutions that participated in the study reported a 10% decline in graduate applications and first-time enrollment to engineering programs.
As the only report of its kind to offer data on the current academic year, International Graduate Applications and Enrollment: Fall 2017 reports applications, admissions, and enrollments of international master’s, certificate, and doctoral students at U.S. colleges and universities.
About the survey and report
Conducted since 2004, the CGS International Graduate Admissions Survey tracks the applications and enrollments of international students seeking U.S. master’s and doctoral degrees. In Fall 2016 the survey was redesigned to collect data by degree objective (master’s and graduate certificate vs. doctorate), and for all seven regions of origin, eight countries of origin, and all eleven broad fields of study, yielding the only degree-level data currently available for graduate admissions and enrollments. 377 U.S. graduate institutions who are members of CGS or its regional affiliates responded to the 2017 survey.
###
The Council of Graduate Schools (CGS) is an organization of approximately 500 institutions of higher education in the United States and Canada engaged in graduate education, research, and the preparation of candidates for advanced degrees. The organization’s mission is to improve and advance graduate education, which it accomplishes through advocacy in the federal policy arena, research, and the development and dissemination of best practices.
Hironao Okahana, Assistant Vice President, Research & Policy Analysis, CGS
Enyu Zhou, Education Research Analyst, CGS
A large majority of graduate students in the United States pursue master’s degrees. According to the most recent CGS/GRE Survey of Graduate Enrollment and Degrees (GE&D), more than twice as many applications for admission were submitted to master’s programs than doctoral programs, and four out of five first-time graduate students enrolled in Fall 2016 were enrolled in programs leading to a master’s degree or a graduate certificate. Furthermore, the large majority (83%) of degrees awarded in 2015-16 were master’s degrees, while the share of doctoral degrees was 11% and graduate certificates was 6.2%. The sheer size of the student body and degrees awarded make master’s education a critical part of the graduate education enterprise that affects institutional missions, enrollment models, and financial planning across different sectors of higher education. This article highlights several results from the most recent GE&D survey that pertain specifically to master’s education.
Application & First-time Enrollment
The volume of applications for admission to master’s programs continues to increase. Between Fall 2015 and Fall 2016, applications for admission to master’s/other programs increased 1.4%, which was a larger rate of growth than that of doctoral applications (0.8%). Over the last ten years, between Fall 2006 and Fall 2016, master’s applications grew on average by 7.0% each year, while doctoral applications only grew by 3.3% annually. Also on average, first-time graduate enrollment in master’s programs grew by 3.1% annually between Fall 2011 and Fall 2016, compared to 2.7% in first-time doctoral enrollment.
Figure 1 shows the trends in first-time master’s enrollment by broad field of study for the decades spanning Fall 2006 to Fall 2016. The increases in first-time master’s enrollments have been particularly large in business, health science, engineering, and mathematics and computer sciences. Though it is a smaller field of study in comparison, biological & agricultural sciences continues steady growth in first-time enrollment. The first-time enrollment in education master’s programs remains the second largest broad field of study, despite the sharp drop in first-time enrollment in the early 2010s. In addition, first-time enrollment in education master’s programs appears to be slowly rebounding from previous declines (since Fall 2013).
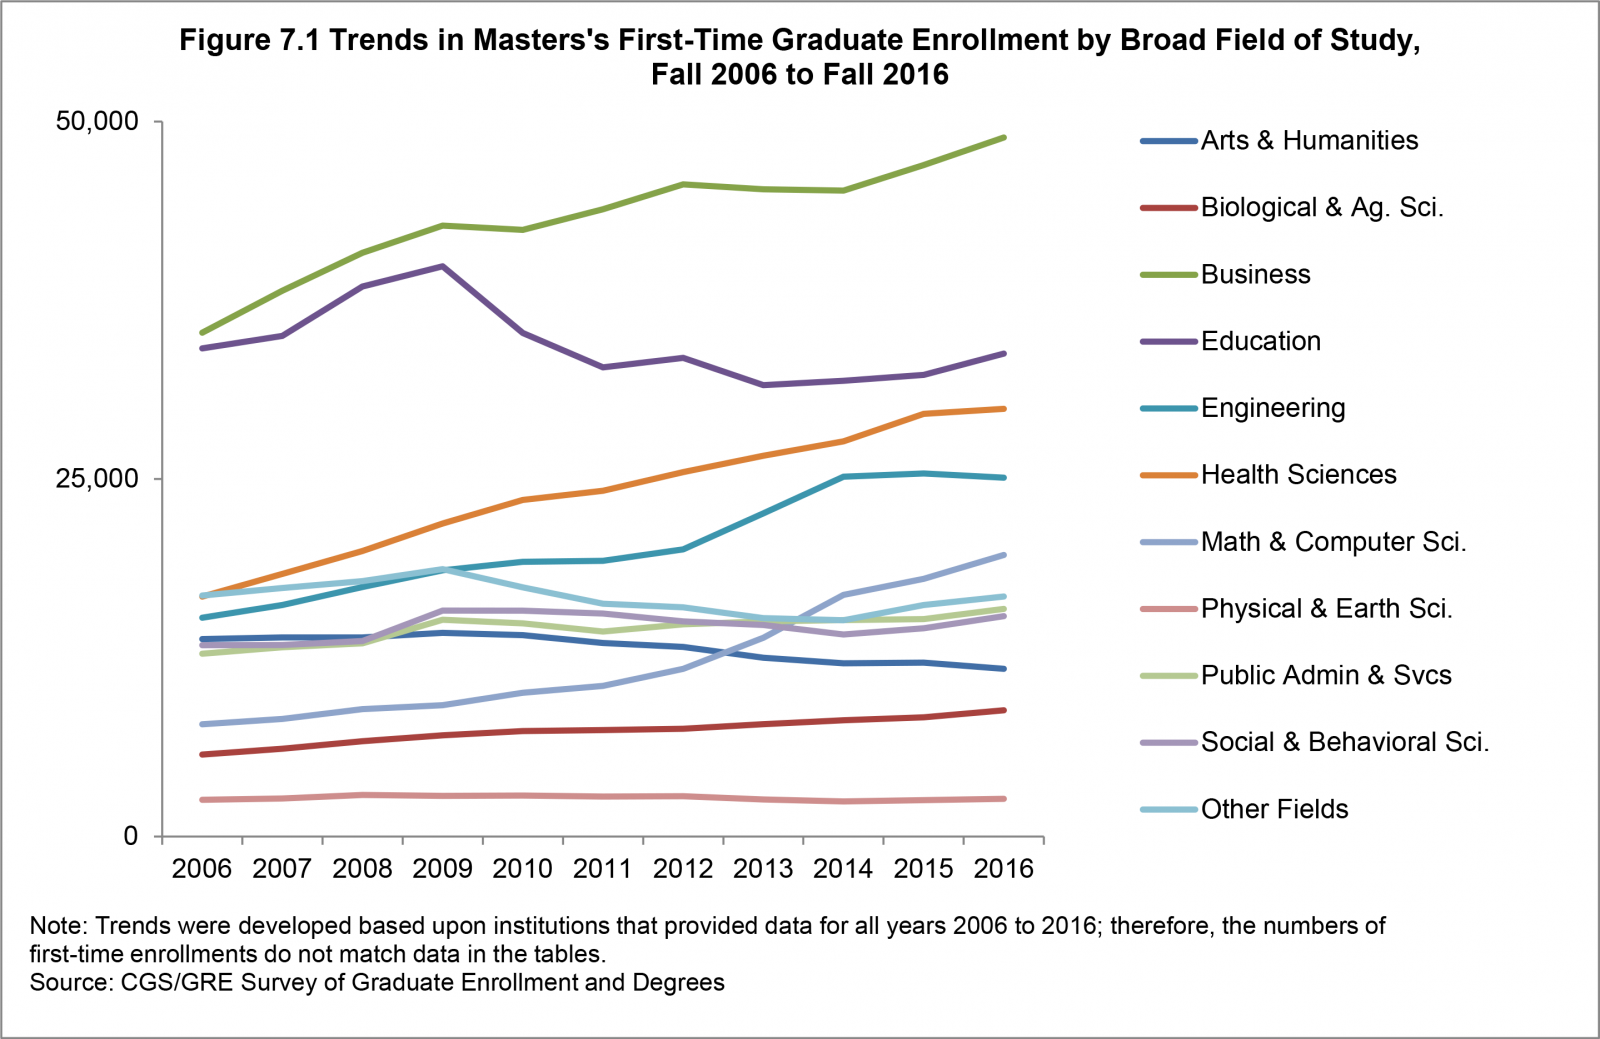
On the other hand, the first-time enrollment in arts and humanities master’s programs has slowly declined since Fall 2009. It also appears that the growth in mathematics & computer sciences has slowed down significantly, and first-time enrollment in engineering master’s programs has flattened in recent years. These two fields of study enroll many international students—61% and 56% of first-time master’s and doctoral students in Fall 2016. Given the current policy and political climate surrounding Optional Practical Training (OPT) and H-1B visa programs, this is an area that may warrant continued attention from the graduate education community.
Women comprised a larger majority (59%) of first-time enrollment at the master’s level than at the doctoral level (53%) in Fall 2016. In particular, more than three out of four first-time master’s students in health sciences (79%), public administration and services (79%), and education (76%) were women. In contrast, women comprised a minority of the students in master’s programs in engineering (26%), mathematics and computer sciences (36%), and physical and earth sciences (46%). However, the percentage shares of women in mathematics and computer sciences and physical and earth sciences were much greater in comparison to doctoral programs (27% and 36%, respectively). This indicates that in these fields, master’s programs play an important role in facilitating women’s participation in the advanced STEM workforce.
Total Master’s Enrollment & Degrees Conferred
Nearly three out of four (74%) graduate students at the institutions that participated in the Fall 2016 GE&D survey were in master’s programs. In fields such as business (94%), public administration and services (93%), education (79%), and mathematics and computer sciences (78%), the share of master’s students was particularly robust. It is not surprising that more than nine out of ten (94%) graduate students at Master’s Colleges and Universities were enrolled in master’s programs. However, it is noteworthy that about three out of four graduate students at Doctoral Universities with Moderate Research (77%) and Higher Research (75%) were also master’s students. Furthermore, even at Doctoral Universities with Highest Research activity, 63% of all graduate students in Fall 2016 were pursuing master’s degrees.
Similarly, more than four out of five (83%) graduate degrees and certificates awarded between 2015-16 at the institutions that participated in the Fall 2016 GE&D survey were master’s degrees. This compares to 11% for doctoral degrees and 6.2% for graduate certificates. Not surprisingly, 90% of graduate degrees and certificates awarded at Master’s Colleges and Universities were master’s degrees. However, more than eight out of ten graduate degrees and certificates conferred by Doctoral Universities with Highest Research (80%), Higher Research (81%), and Moderate Research (84%) were also master’s degrees. These enrollment and degrees data reinforce the idea that master’s education is an integral part for all sectors of the graduate education enterprise.
Institutions participating in the Fall 2016 GE&D survey reported a 3.2% increase in the number of master’s degrees awarded between 2014-15 and 2015-16, compared to the 2.7% growth in doctoral programs. The increase was particularly robust at Doctoral Universities with Moderate Research (8.2%), although, these institutions also reported a high rate of increase in the number of doctoral degrees awarded (7.0%). Interestingly, the number of doctoral degrees awarded by Doctoral Universities with Higher Research decreased by 6.2% between 2014-15 and 2015-16, while the number of master’s degrees awarded remained virtually flat (0.8%). The increases in the number of master’s degrees awarded between 2014-15 and 2015-16 were particularly robust in biological and agricultural sciences (15%), health sciences (14%), and engineering (12%). However, numbers declined in arts and humanities (-3.7%) and social and behavioral sciences (-0.3%).
Discussion
Master’s education encompasses a wide range of programs and fields of study. It is a segment of the graduate education enterprise that is difficult to analyze given the diversity of students it serves and the workforce needs it aims to address. Nevertheless, as the only national data source that captures comprehensive application, enrollment, and degrees data on master’s degrees in all fields, the GE&D survey offers valuable insight into the graduate education community. These insights are meant to help advance campus-level conversations that will lead to innovative, responsive, and distinctive approaches in master’s education.
The U.S. workforce needs more master’s degree holders, but graduate programs will need to closely align their curriculum to offer skills and competencies needed for graduates to be successful. The CGS Master’s Committee has developed the Alignment Framework, a model that provides a roadmap for graduate deans and institutional leaders to create workforce-ready high-quality master’s programs that can best serve their region, state, and beyond. In addition, CGS, in partnership with Educational Testing Services, has launched an investigation of master’s admissions practices titled Master’s Admission Attributes: Current Status and Missing Evidence. Through four regional focus groups, the project will attempt to connect master’s admission criteria to outcomes and competencies and inform future admissions practices.
Beyond these projects, CGS encourages the robust exchange of ideas and promising practices surrounding master’s education among our member deans. At the upcoming Annual Meeting, there will be a pre-meeting workshop session that focuses on master’s enrollment management, as well as several concurrent sessionsthat focus on master’s topics. In the meantime, we encourage our members to take advantage of the Dean’s Discussion Board to pose questions and/or share insights with fellow graduate deans on this topic.
The full report of the most recent CGS/GRE Survey of Graduate Enrollment and Degrees, Graduate Enrollment and Degrees: 2006-2016, is available online. For questions regarding the report and this article, please contact Enyu Zhou, CGS education research analyst. For inquiries regarding CGS Master’s Projects, please contact Robert M. Augustine, CGS senior vice president.
FOR IMMEDIATE RELEASE:
Contact: Katherine Hazelrigg (202) 461.3888/ khazelrigg@cgs.nche.edu
Data Indicate Increasing Number of Graduate Certificates Awarded
Washington, DC — Today the Council of Graduate Schools (CGS) reported continued growth in total graduate enrollment, first-time enrollments, number of applications, and degrees conferred at U.S. universities in its report, CGS/GRE Graduate Enrollment & Degrees: 2006-2016. The majority of growth in Fall 2016 continues to be in programs leading to master’s degrees, which comprise 82.5% of degrees awarded in 2015-16. In addition, the number of graduate certificates awarded by institutions participating in the survey increased by 11.8% between 2014-15 and 2015-16, suggesting that a growing number of students see the value in these micro-credentials.
“The consistent growth in applications, first-time enrollment, and degrees conferred in programs leading to master’s degrees indicates that graduate education is meeting the increasing workforce demand for advanced degree holders. The unemployment rates are lower for advanced degree holders. More and more jobs are requiring a higher skill level, and graduate education is adapting to meet those needs, as evidenced by the increase in graduate certificates,” said CGS President Suzanne Ortega.
For the second year in a row, all underrepresented minority (URM) groups monitored by the survey saw greater increases in first-time graduate enrollment than their White, non-Hispanic counterparts, even though their overall representation in the graduate student body remains relatively low. Among first-time U.S. citizens and permanent resident graduate students in the Fall of 2016, approximately 23.4% were underrepresented minorities, including American Indian/Alaska Native (0.5%), Black/African American (11.8%), Native Hawaiian/Other Pacific Islander (0.2%), and Hispanic/Latino (10.9%). The one-year rate of change in first-time graduate enrollment for most URM groups was greater than its respective five-year and ten-year average percentage change.
“I’m cautiously optimistic at the continued increase in overall first-time enrollments for underrepresented minorities,” said Ortega. “However, URMs remain proportionally underrepresented. We still have a lot of work to do to ensure this is a sustained trend across graduate programs and leads to a more diverse workforce.”
This year’s survey results show first-time graduate enrollment of international students decreased 0.9% between Fall 2015 and Fall 2016. It is the first decrease since 2003, though the five-year average annual increase (7.8%) and ten-year average annual increase (7.4%) rates remain high. In contrast, first-time graduate enrollment for U.S. citizens and permanent residents increased 3.2%. Conversely, the total graduate enrollment increased by 2.4% for international students and decreased by 0.1% for U.S. citizens and permanent residents over the same Fall 2015-2016 period.
For the fifth consecutive year, institutions responding to the CGS/GRE Survey of Graduate Enrollment & Degrees for Fall 2016 reported increases in first-time graduate enrollment (522,131). More than one half of those first-time graduate students were women (58.1%). New highs for the application and admission cycle were also achieved, with institutions receiving more than 2.2 million applications and extending over 903,000 offers of admission in Fall 2016 for graduate students in graduate certificate, education specialist, master’s, or doctoral programs.
Other report findings are summarized below.
Findings by Broad Field
Findings by Degree Level
Findings by Student Demographics
About the report
Graduate Enrollment and Degrees: 2006 to 2016 presents the findings of an annual survey of U.S. graduate schools, co-sponsored by CGS and the Graduate Record Examinations (GRE) Board. It is the only annual national survey that collects data on graduate enrollment by all fields of study and is the only source of national data on graduate applications by broad field of study. The report, which includes responses from 625 institutions, presents statistics on graduate applications and enrollment for Fall 2016, degrees conferred in 2015-16, and trend data for one-, five- and ten-year periods.
###
The Council of Graduate Schools (CGS) is an organization of approximately 500 institutions of higher education in the United States and Canada engaged in graduate education, research, and the preparation of candidates for advanced degrees. The organization’s mission is to improve and advance graduate education, which it accomplishes through advocacy in the federal policy arena, research, and the development and dissemination of best practices.
Hironao Okahana, Assistant Vice President, Research & Policy Analysis, Council of Graduate Schools
With nearly one out of five U.S. master’s and doctoral students being international students, the Council of Graduate Schools (CGS), graduate deans, and the graduate education community have high stakes in supporting the recruitment and success of international graduate students and scholars pursuing their studies in the United States. Though it has been over five months since the first immigration executive order was signed, much uncertainty remains as to how the current political climate and immigration policies may be affecting that flow. A short survey conducted by CGS finds that member deans are seeing a decline in admission yields of prospective international graduate students, a sign that the global appeal for U.S. graduate education may be suffering.
About the Survey
To offer insight into this ongoing and developing event, CGS fielded a short survey to its member deans, asking them to report changes in admission yields for this year, compared to the last. The survey was sent to all 464 graduate deans or their equivalents at CGS member institutions based in the United States via email between May 22 and June 7, 2017. The response rate was 38%, with 176 institutions recording valid responses. Of the respondents, 38% were Doctoral Universities - Highest research activity (R1), 33% were Doctoral Universities - Higher or Moderate research activity (R2 & R3), and 29% were Master’s Colleges and Universities and other institution types. The survey asked deans to indicate any substantial changes in percentages of offers of admission accepted by prospective international graduate students, or admission yields, by degree level and region of origin. As a reference point, the survey also asked graduate deans to report any substantial changes they may be observing in admission yields of prospective graduate students who are U.S. citizens and permanent residents.
Survey Results
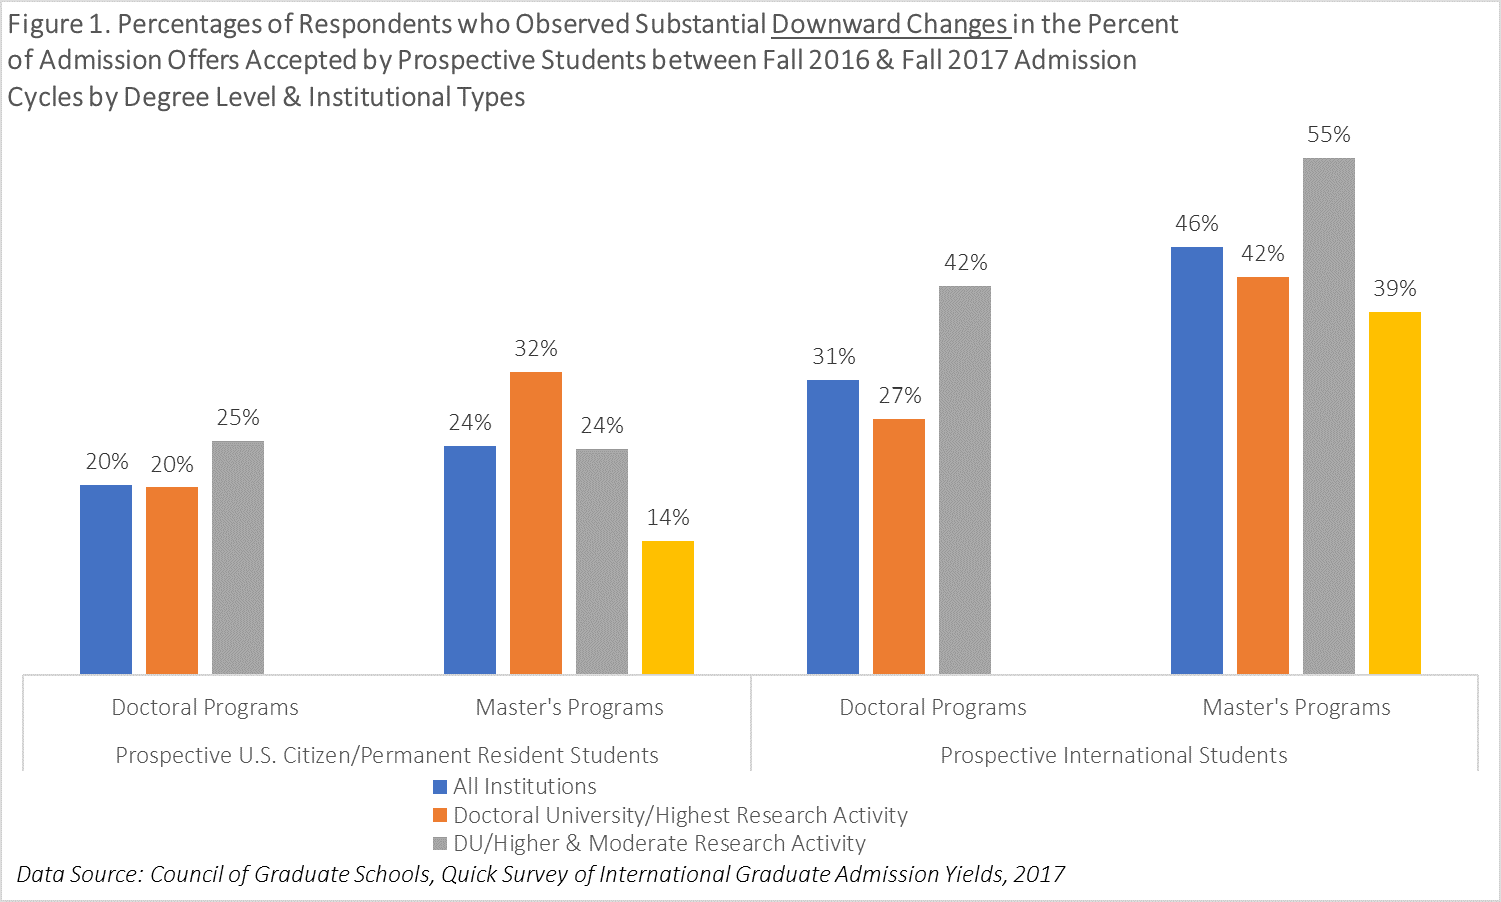
First, the data indicate that more graduate deans are seeing declines in admission yields of prospective international graduate students than of prospective U.S. citizen/permanent resident graduate students. Particularly for prospective master’s students, 46% of graduate deans indicated that they are seeing substantial downward changes in admission yields for international students, while only 24% reported the same for domestic students. At the same time, 41% of graduate deans reported that they are seeing substantial upward changes in admission yields for prospective domestic master’s students. Given that the large majority of international graduate students are offered admission into master’s degree programs, this may have substantial implications for first-time enrollment of international graduate students for Fall 2017.
Second, declines in admission yields for prospective international graduate students were more pronounced at R2 and R3 institutions. Over one half of respondents at R2 and R3 institutions (55%) indicated that they are seeing substantial downward changes in admission yields of prospective international master’s students. This is compared to 42% at R1 institutions and 39% at Master’s Colleges and Universities and others. The contrast was even more dramatic for admission yields of prospective international doctoral students. Forty-two percent of graduate deans at R2 and R3 institutions indicated that they are seeing substantial downward changes, while only 27% of their counterparts at R1 institutions reported the same.
Finally, declines in admission yields of prospective international graduates vary by regions of origin. Fifty-two percent of graduate deans reported that they are seeing declines in admission yields for prospective international graduate students from the Middle East and North Africa region. The observation of downward changes was particularly pronounced at R1 institutions, where 60% of graduate deans reported declines in admission yields for students from that region. Also, forty-two percent of graduate deans indicated that they are seeing a decline in students from Asia. Notably, 55% of graduate deans at R2 and R3 institutions reported substantial downward changes in admission yields of prospective Asian graduate students. For other regions, many fewer graduate deans reported a decline, and the majority of them noted no substantial changes in international admission yields.
Discussion
In the CGS Pressing Issues Survey earlier this year, nearly one half of graduate deans at U.S. doctoral universities (48%) indicated that they were seeing downward changes in international graduate applications this year, compared to the last application cycle. With the second immigration executive order now making its way to the U.S. Supreme Court, the Administration’s continued scrutiny of the visa review processes at U.S. consulates abroad, as well as H-1B visa and optional practical training programs, much uncertainty still remains. Yet, a few key indicators have emerged to offer additional insight into how these policies may be affecting the flow of international graduate students and scholars to the United States.
A recent review by POLITICO noted that fewer non-immigrant visas, including F-1 visas that international graduate students need, were granted this year as compared to last year, particularly in Arab countries. However, the visa issuance statistics alone are difficult to interpret, since we do not know whether this is because of fewer applications submitted, fewer applications approved, or a combination of both. An examination of admission yields offers additional insight, as the decline suggests that fewer students are willing to pursue opportunities for graduate education in the United States, even when acceptance into a degree program is offered to them. Prospective international graduate students appear more likely, in particular, to turn down those opportunities at the master’s level, as well as at R2 and R3 institutions. While the survey cannot pinpoint particular factors that might be shaping such shifts, the uncertainty with prospects of post-graduate school employment under optional practical training and/or H-1B visa programs, as well as opportunities to pursue graduate education in other English-speaking countries, may in part explain some of the declines graduate deans are observing.
CGS remains committed to seeing U.S. graduate education remain open and that U.S. graduate schools continue to be the desired destination for talented students and scholars both domestic and from abroad. More importantly, CGS is the platform for our member deans to exchange ideas and promising practices that may strengthen the global appeal of U.S. graduate education collectively. At the upcoming Summer Workshop in Denver, CGS is pleased to welcome Esther Brimmer, executive director and CEO of NAFSA: Association of International Educators to hear her perspective on this subject. Also at the Annual Meeting later this year, we will convene a pre-meeting workshop to discuss strategies and approaches for recruiting international graduate students. In the meantime, we encourage our members to take advantage of the Dean’s Discussion Board to pose questions and/or share insights with fellow graduate deans.
Hironao Okahana, Assistant Vice President, Research & Policy Analysis
The CGS Pressing Issues Survey is an important vehicle for the Council of Graduate Schools (CGS) to stay apprised of the key priorities for our member deans. The 2017 survey was administered to all 485 graduate deans or equivalent at CGS member institutions based in the U.S. and Canada via email between February 1 and February 17, 2017. The response rate was 42%, with 205 institutions recording their survey responses. The survey asked a range of questions regarding priorities for graduate deans, graduate schools, and their home institutions for the upcoming twelve months, as well as observations of graduate application trends. This article provides insights into three key areas: graduate application trends, advocacy, and diversity.
Graduate Application Trends
International Application Trends
Nearly one half of graduate deans at U.S. doctoral universities (48%) indicated they are seeing downward changes in international graduate applications this year, compared to the last application cycle. A little over one-third (37%) indicated they are seeing no substantial change. In contrast, only one quarter of U.S. master’s colleges and university graduate deans observed substantial downward changes in international graduate applications. Of those graduate deans who indicated downward changes in international graduate applications, the majority (53%) attributed the shifts to “Other Factors.” Many wrote in concerns related to the current political climate and immigration policies. Though only seven Canadian institutions responded to this survey, all seven graduate deans at these institutions indicated upward changes in international graduate applications with some attributing the increase to recent U.S. policies.
However, at this point, it may be premature to attribute the downward trend of international applications entirely to the recent immigration executive orders. CGS previously reported a 1% growth in international graduate applications between Fall 2015 and Fall 2016 and attributed some of this decline to economic factors. Also, while some may link this to the November election results, the recent immigration executive orders were not issued until the Fall 2017 application cycle was well underway. Much uncertainty remains with pending court cases, and a clearer understanding of the impact on international graduate admissions will be seen in admission yield rates, visa issuance statistics, and matriculation rates for the upcoming Fall semester and beyond. Nevertheless, a chilling effect has been felt across the graduate education community, and CGS remains concerned regarding the potential adverse impact of these policies.
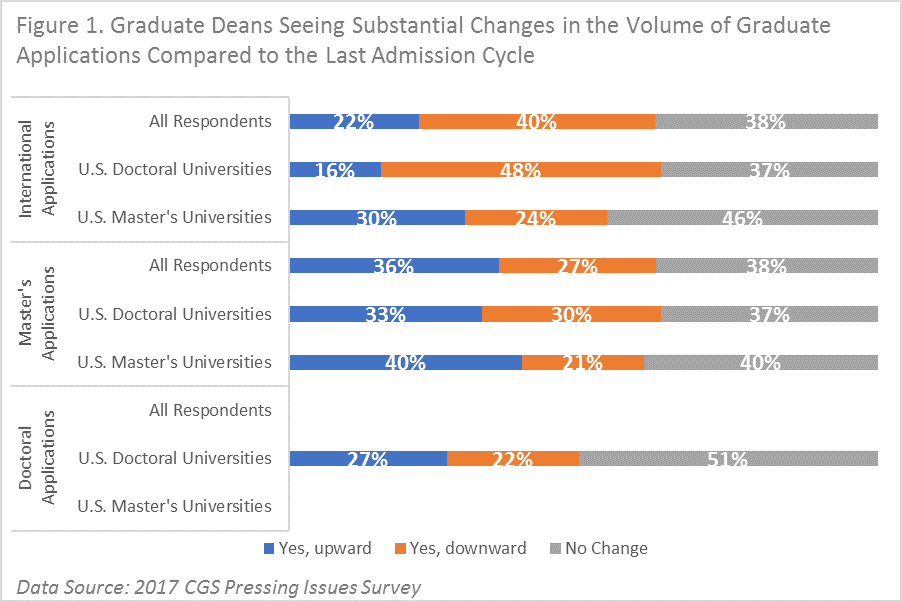
Doctoral & Master’s Application Trends
Overall, the vast majority of graduate deans observed no change (38%) or upward change (36%) in master’s applications. A little over one-fourth of graduate deans (27%) reported a downward change in master’s applications compared to the last application cycle. Though graduate deans at U.S. doctoral universities were more likely to report downward changes in master’s applications (30%) than their counterparts at U.S. master’s colleges and universities (21%). The majority of U.S. doctoral university graduate deans (51%) observed no substantial changes in doctoral applications compared to the last application cycle.
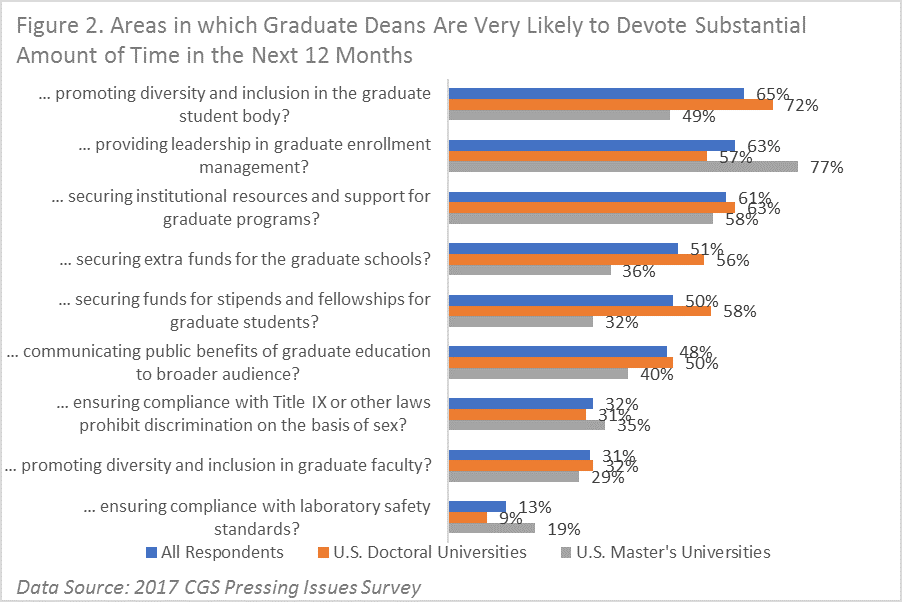
More than three out of four graduate deans (77%) at U.S. master’s colleges and universities indicated they will very likely be providing leadership in graduate enrollment management in the next twelve months. In contrast, only 57% of graduate deans at U.S. doctoral universities plan the same, and nearly one out of ten (9%) indicated they are not likely to provide leadership in this area. The number of graduate program offerings seem to remain on a growth trajectory. More than eight out of ten graduate deans reported their institutions will very likely (57%) or likely (25%) create one or more graduate degree program in the next twelve months. Nearly two out of five (38%) graduate deans indicated their institutions are not likely to eliminate one or more graduate degree program in the next twelve months.
Advocacy and Public Affairs
Compared to other key priorities, such as resource acquisitions and graduate enrollment management, communicating the public benefit of graduate education to broader audiences did not emerge as a top issue for graduate deans. Less than one half of graduate deans surveyed (47%) indicated they are very likely to communicate the public benefits of graduate education to broader audiences, although 35% said they are likely to do so. However, a more striking finding is that over one third of graduate deans at U.S. doctoral universities (35%) and U.S. master’s colleges and universities (34%) reported that their offices are not likely to proactively reach out to their Congressional representatives. This response may be, in part, a result of organizational structures at CGS member institutions. Many, particularly large institutions, have separate external relations/government affairs offices that serve as designated points of contact with policymakers and other external audiences.
However, given the current political climate toward federal funding support for graduate education, humanities, and science, this is a critical time for our community to organize and make its voice heard. If not able to directly engage legislative representatives, graduate deans can still provide resources on the importance of graduate education to their university officers, who subsequently can use those materials with external stakeholders and policymakers. CGS offers many resources graduate deans can use to engage in advocacy efforts, including examples of advocacy materials developed by their peers. We encourage graduate deans to engage both on-campus and external stakeholders of graduate education. In addition, CGS invites member institutions to share stories about innovative and exceptional graduate students and alumni via #GradImpact. This project provides our community with an opportunity to demonstrate that graduate education matters not only to degree holders, but also to the communities where they live and work.
Diversity and Inclusiveness
Diversity and inclusiveness for graduate students remain one of the top priorities for graduate deans. Nearly two-thirds of graduate deans (65%) indicated they will very likely promote diversity and inclusion in the graduate student body in the next twelve months. Also, eight out of ten indicated that their institutions will very likely (44%) or likely (36%) adopt new student recruitment strategies to enhance diversity and inclusiveness. The sentiment was particularly strong at U.S. doctoral universities, as 72% of graduate deans reported they will very likely promote graduate student diversity in the coming year.
In contrast, less than one third of graduate deans (31%) indicated they will promote diversity and inclusiveness in graduate faculty in the next twelve months, with 18% of them noting they are not likely to do so. This, perhaps, is in part because few graduate deans have direct involvement in faculty recruitment and hiring decisions, as those functions are primarily handled by other units (e.g., individual departments, faculty affairs offices, etc.). However, there are opportunities for graduate deans to actively influence faculty recruitment and hiring practices. Moreover, efforts to facilitate diversity and inclusiveness in the professoriate go hand in hand with our efforts to increase diversity in the graduate student body. For example, with funding support from the National Science Foundation’s (NSF) Alliances for Graduate Education and Professoriate (AGEP), the Big Ten Academic Alliance, which includes several CGS member graduate deans, has developed case-studies and facilitation guides on unconscious bias during the hiring process. At the upcoming CGS Summer Workshop, there will also be a session on strategies for improving diversity in the STEM professoriate, which will feature some key takeaways from the recent CGS AGEP National Forum.
The full results from the 2017 CGS Pressing Issues Survey will be made available later in the spring. In addition, findings were discussed in a CGS Webinar, “Top Issues and Priorities for Graduate Deans,” on Tuesday, April 4, 2017, and the webinar recording will be available here. We encourage member deans to continue to examine key priorities on their campuses and how they align with those identified by the larger community. We hope that you will let us know how CGS can remain a go-to resource as you seek to address the pressing issues graduate deans face.
![]()