

Thank you for visiting CGS! You are currently using CGS' legacy site, which is no longer supported. For up-to-date information, including publications purchasing and meeting information, please visit cgsnet.org.
Benchmarking

CGS is the leading source of information, data analysis, and trends in graduate education. Our benchmarking data help member institutions to assess performance in key areas, make informed decisions, and develop plans that are suited to their goals.
Figure 1: Total International Graduate Applications and First-time Enrollment by Degree Type, Fall 2016 to Fall 2019 (Excel, JPEG)
Figure 2: One-year Change in International Graduate Applications and First-time Enrollment by Degree Objective and Institutional Type between Fall 2018 and Fall 2019 (Excel, JPEG)
Figure 3: One-year Change in International Graduate Applications & First-time Enrollment by Selected Country & Region of Origin between Fall 2018 and Fall 2019 (Excel, JPEG)
Figure 4: One-year Change in International Graduate Applications and First-time Enrollment by Selected Field of Study between Fall 2018 and Fall 2019 (Excel, JPEG)
Table A1: Annual Changes in Final International Graduate Applications by Region/Country of Origin, Fall 2012 to Fall 2019 Admission Cycles (Excel, JPEG)
Table A2: Annual Changes in First-time International Graduate Enrollment by Region/Country of Origin, Fall 2012 to Fall 2019 Admission Cycles (Excel, JPEG)
Table A3: Annual Changes in Final International Graduate Applications by Field of Study, Fall 2012 to Fall 2019 Admission Cycles (Excel, JPEG)
Table A4: Annual Changes in First-time International Graduate Enrollment by Field of Study, Fall 2012 to Fall 2019 Admission Cycles (Excel, JPEG)
Table B1: Final International Graduate Applications by Region/Country of Origin, Fall 2019 Admission Cycle (Excel, JPEG)
Table B2: Offers of Admission to International Graduate Applicants by Region/Country of Origin, Fall 2019 Admission Cycle (Excel, JPEG)
Table B3: First-time International Graduate Enrollment by Region/Country of Origin, Fall 2019 Admission Cycle (Excel, JPEG)
Table B4: Total International Graduate Enrollment by Region/Country of Origin, Fall 2019 Admission Cycle (Excel, JPEG)
Table C1: Final International Graduate Applications by Field of Study, Fall 2019 Admission Cycle (Excel, JPEG)
Table C2: Offers of Admission to International Graduate Applicants by Field of Study, Fall 2019 Admission Cycle (Excel, JPEG)
Table C3: First-time International Graduate Enrollment by Field of Study, Fall 2019 Admission Cycle (Excel, JPEG)
Table C4: Total International Graduate Enrollment by Field of Study, Fall 2019 Admission Cycle (Excel, JPEG)
Table D1: Characteristics of Institutions with Valid Responses for the First-time Enrollment Fall 2019 (Excel, JPEG)
By Hironao Okahana and Enyu Zhou
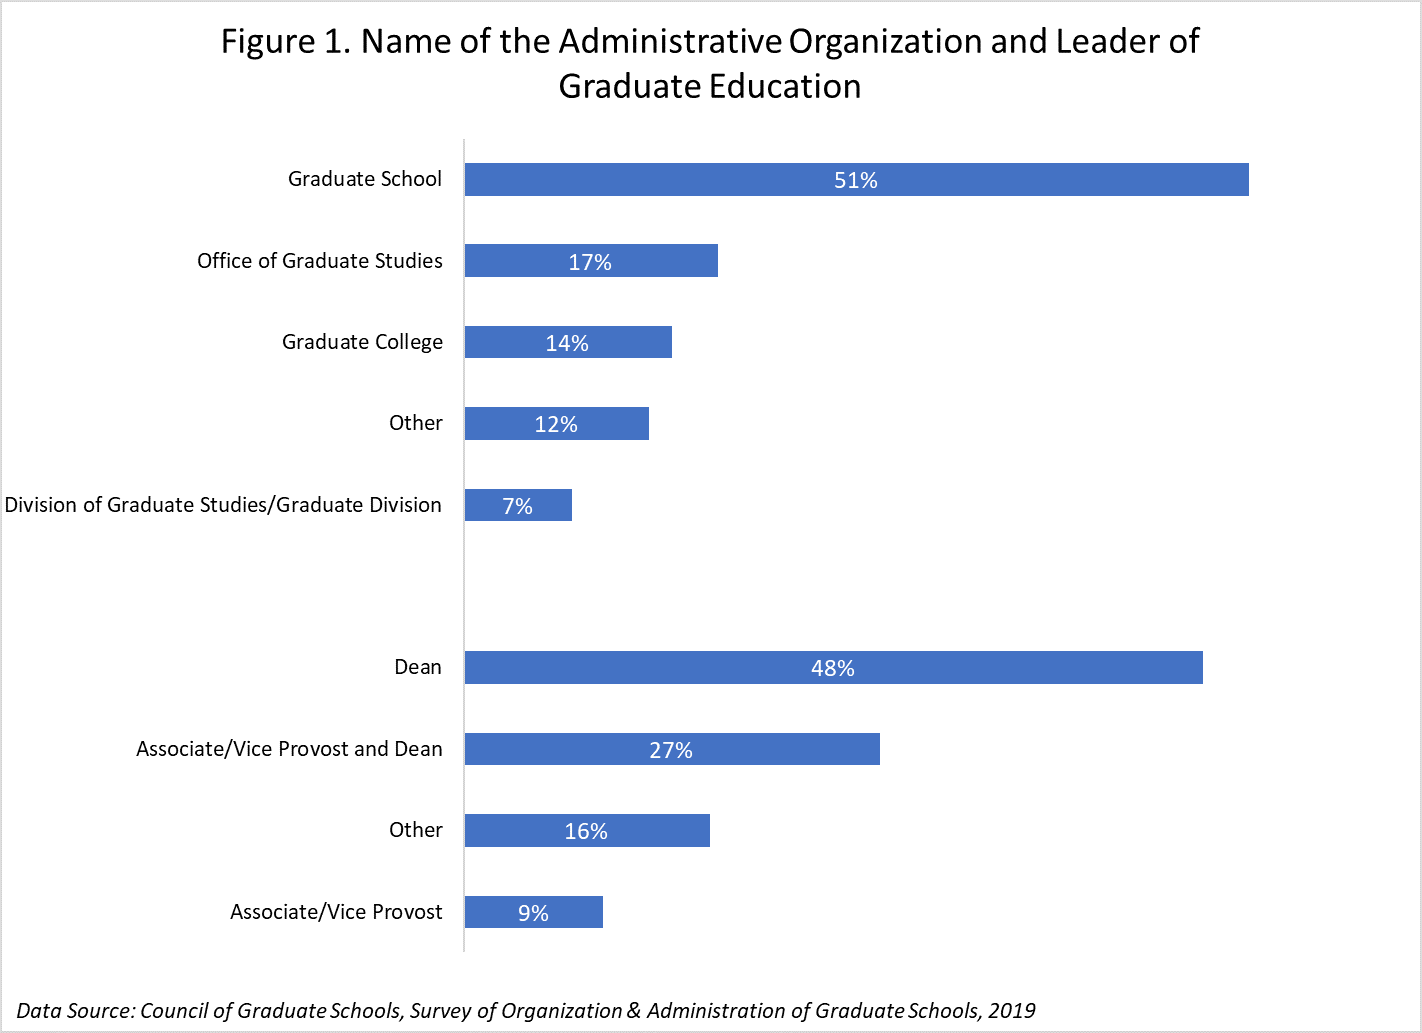
The Council of Graduate Schools (CGS) is a member association of over 480 U.S. and Canadian colleges and universities. Member universities vary in size, scope, and way that graduate programs are organizing and administering. Based on responses from the 200 universities that participated in the 2019 CGS Survey of Organization & Administration of Graduate Education, this brief provides selected insights into how graduate education is organized and administered in the U.S. and Canada. The finding affirms that the majority of responding institutions organizes the responsibilities of graduate education within an organizational unit** led by a dean. This organizational structure provides graduate education administrators with leadership roles that are similar in stature and expectations to those of academic colleges and collegiate deans. We also found that in addition to supporting graduate student success, the organizations responsible for graduate education, particularly at research-intensive institutions, also oversee postdoctoral trainees.
**The term “graduate schools” is formally or colloquially used to refer campus organizational units that hold the responsibility for graduate education across different fields of study. Although formal organizational labels vary between institutions (e.g., Graduate School, Graduate College, Office of Graduate Education, Graduate Division, etc.), in this brief, all such units are referred as “graduate schools” regardless of their formal names.
Key Findings:
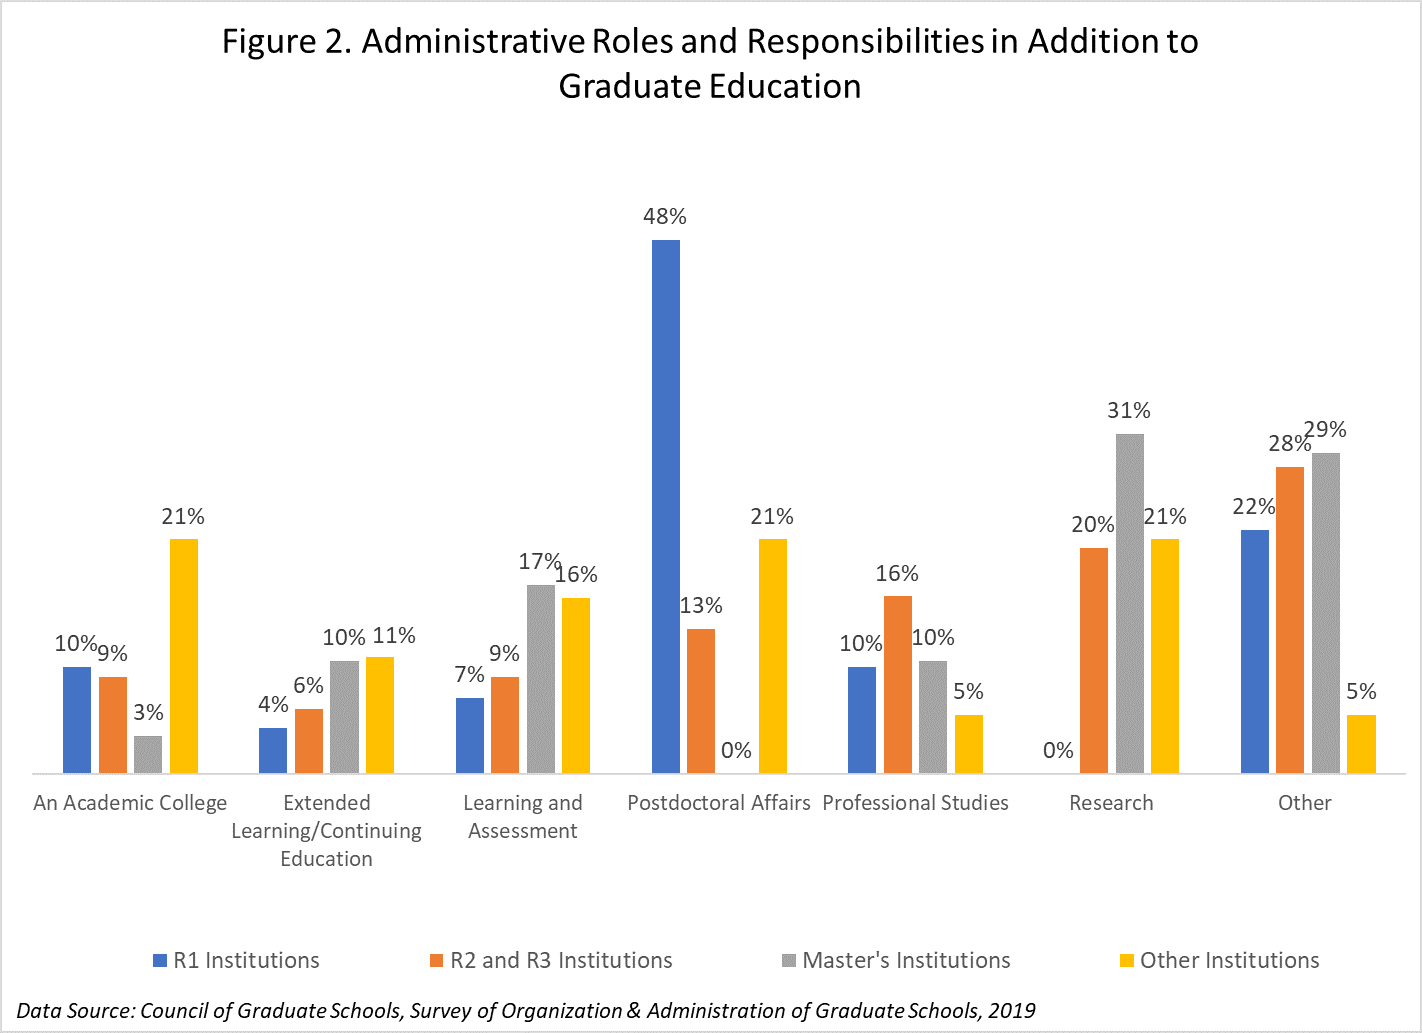
Roughly 48% of the graduate schools from R1 institutions have responsibility for postdoctoral affairs. While 31% of respondents from master’s colleges and universities and 20% of respondents from R2 and R3 institutions indicated that, in addition to graduate education, graduate schools are also responsible for research administration. None of the R1 graduate schools reported responsibility for research administration as an area of their oversight. (Figure 2)
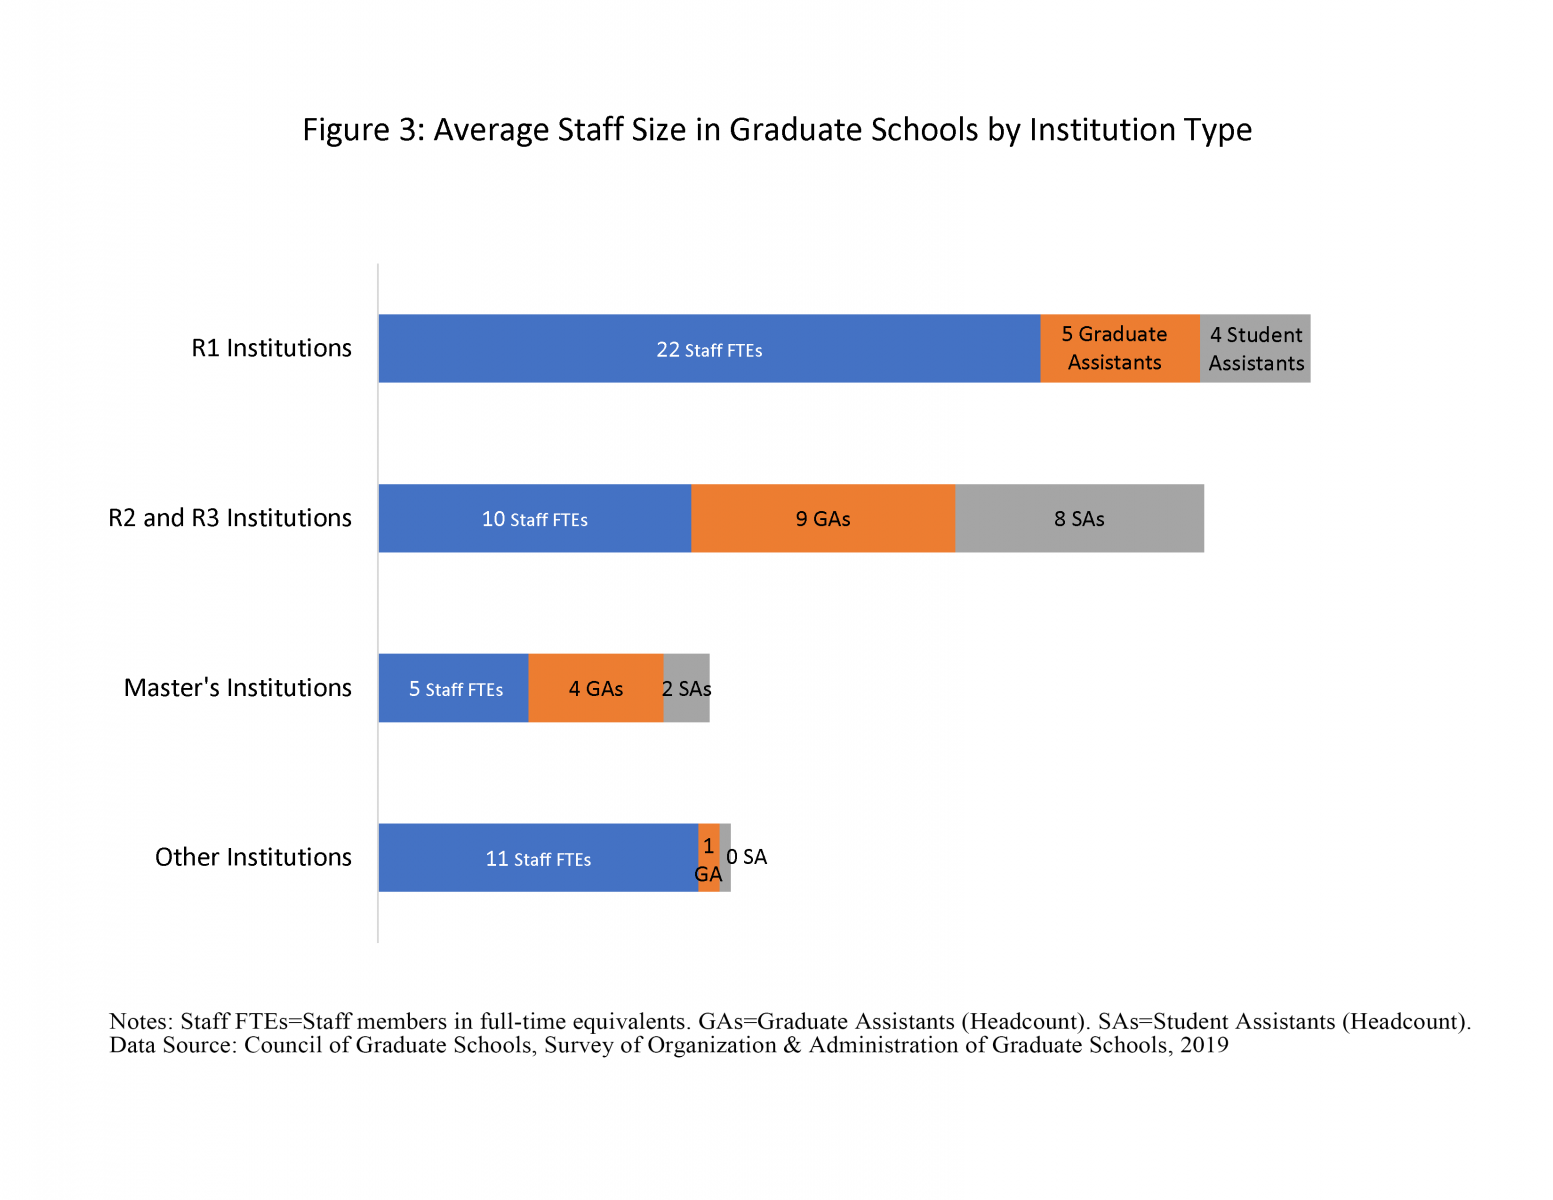
The average number of staff members supporting graduate schools was reported as 22 full-time equivalents (FTEs) at participating R1 institutions, 10 FTEs at R2 and R3 institutions, and 5 FTEs at master’s colleges and universities. The average number of graduate assistants and student assistants working in graduate schools was the highest at R2 and R3 institutions. (Figure 3)
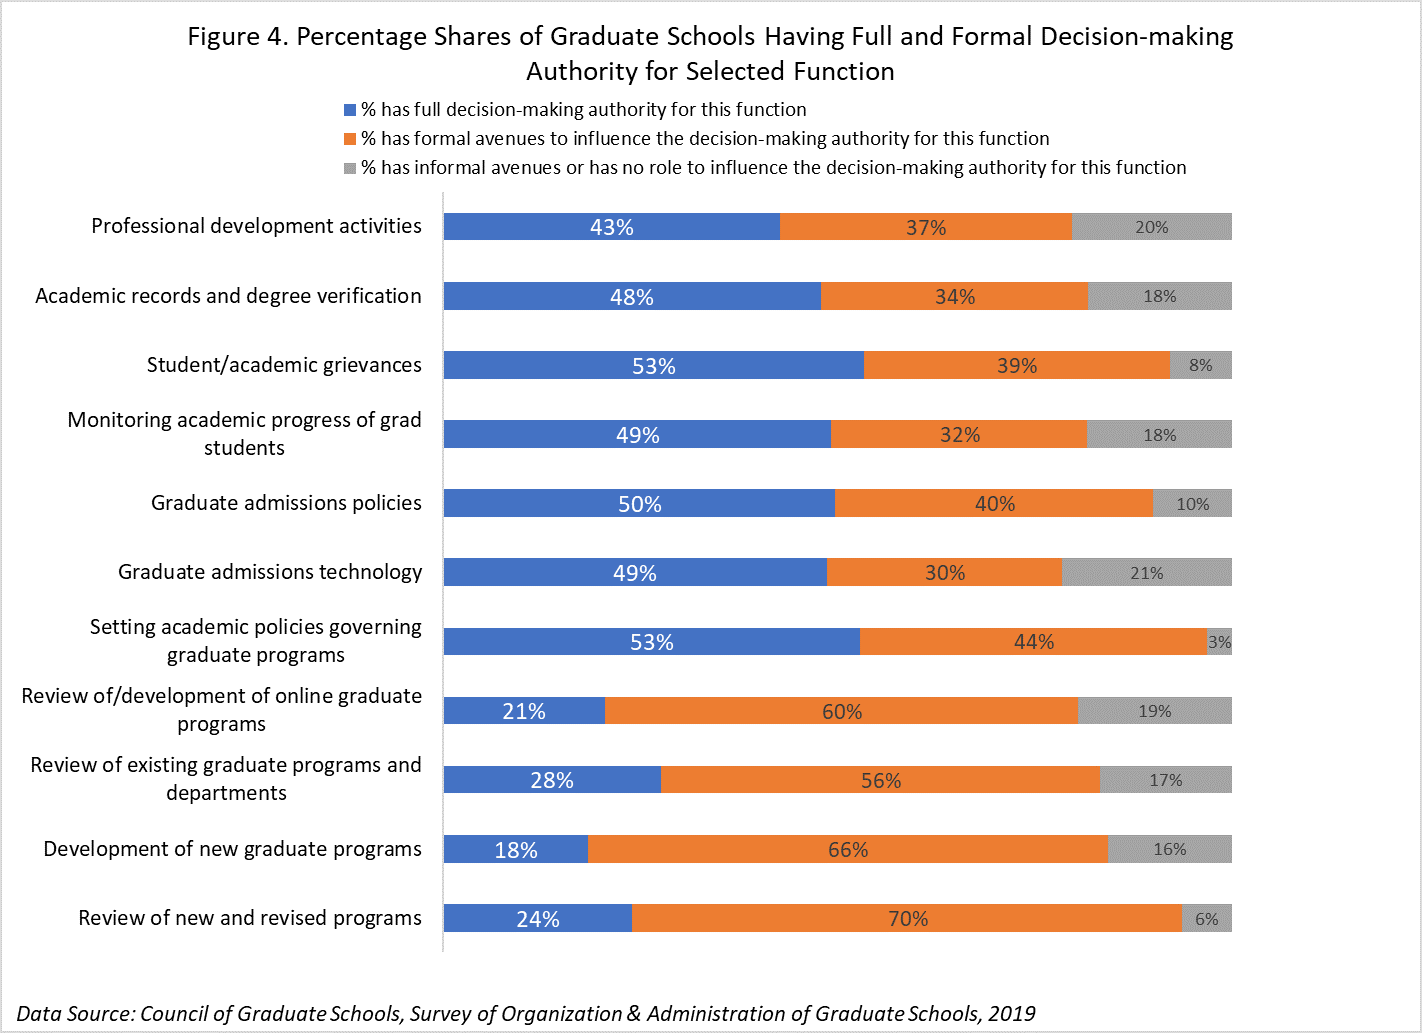
Approximately 50% of respondents indicated that their graduate schools have decision-making authority for setting academic policies governing graduate programs, establishing graduate admissions policies, monitoring the academic progress of graduate students, responding to academic grievances, and managing graduate admissions technology. In other areas, such as review of new and revised programs, development of new graduate programs, and review of/development of online graduate programs, more respondents noted that they have formal input into the decision-making processes at their institutions. (Figure 4)
Takeaway Points:
Conversation Starters:
We encourage graduate education units to engage in conversation about various models for organization and administration of graduate education at your institutions. Some of the questions that you may want to ask as a self-reflection or to your campus colleagues (i.e., college deans, graduate program directors, etc.), as well as with stakeholders include:
Additional Resources:
The Organization and Administration of Graduate Education. This publication provides an overview of the structures, leadership, and strategies that define contemporary graduate education. It also provides case studies from selected graduate schools addressing pressing issues.
CGS Strategic Consultation Services. The Council of Graduate Schools provides strategic consultations to member and nonmember institutions, boards, and state agencies to offer guidance as they make tactical decisions about the administration of graduate education. Our consultations draw upon extensive best practice and benchmarking research as well as the insights of experienced graduate deans from around the country.
About the Data Source:
The Council of Graduate Schools, Survey of Organization & Administration of Graduate Schools was distributed to CGS member institutions and members of the four regional graduate school affiliations in Spring 2019 (US, N=195; and Canada, N=5). This brief is based upon the participants who reported working in one of the four institution types based on the 2015 Carnegie Classification of Institutions of Higher Education. The Basic Carnegie Classification categories are aggregated to four categories as follows: Universities with Highest Research Activity (R1 Institutions), Universities with Higher Research Activity and Universities with Moderate Research Activity (R2 and R3 Institutions), Master’s Colleges and Universities (Master’s Institutions), and Other Institutions. The sample size by institution type is as follows: R1 Institutions (N=71), R2 and R3 Institutions (N=65), Master’s Institutions (N=52), and Other Institutions (N=12).
Author Contribution and Acknowledgment
The brief was prepared by Hironao Okahana and Enyu Zhou. H.O. conceived and designed the project and data collection instrument, as well as supervised the findings of this work. E.Z. performed data cleaning and analysis, prepared the figures and table. Both authors discussed and contributed to the final brief. CGS President Suzanne T. Ortega and CGS Senior Vice President Robert M. Augustine, as well as Radomir Mitic, Janet Gao, and Christian P.L. West provided feedback to earlier drafts of the brief. CGS Best Practices Team, CGS Research and Information Services Committee, CGS Committee on Master’s Degrees, and CGS Consultation Working Group provided feedback to an earlier version of the data collection instrument.
By Hironao Okahana and Christian P.L. West
According to the Council of Graduate Schools (CGS), applications for admission to master’s programs increased by 1.4% and for doctoral programs by 4.1% between Fall 2017 and Fall 2018, while first-time enrollment in these programs grew by 2.0% and 2.9%, respectively (Okahana & Zhou, 2019a). Despite recent declines in international graduate enrollment (Okahana & Zhou, 2019a & 2019b), overall graduate enrollment at U.S. colleges and universities continues to grow, albeit modestly. This is not surprising as workforce demands for graduate degree holders are still growing in the United States. Jobs that require master’s degrees and doctoral degrees at the entry are expected to rise by 13.7% and 9.0% between 2018 and 2028, respectively (U.S. Bureau of Labor Statistics, 2019).
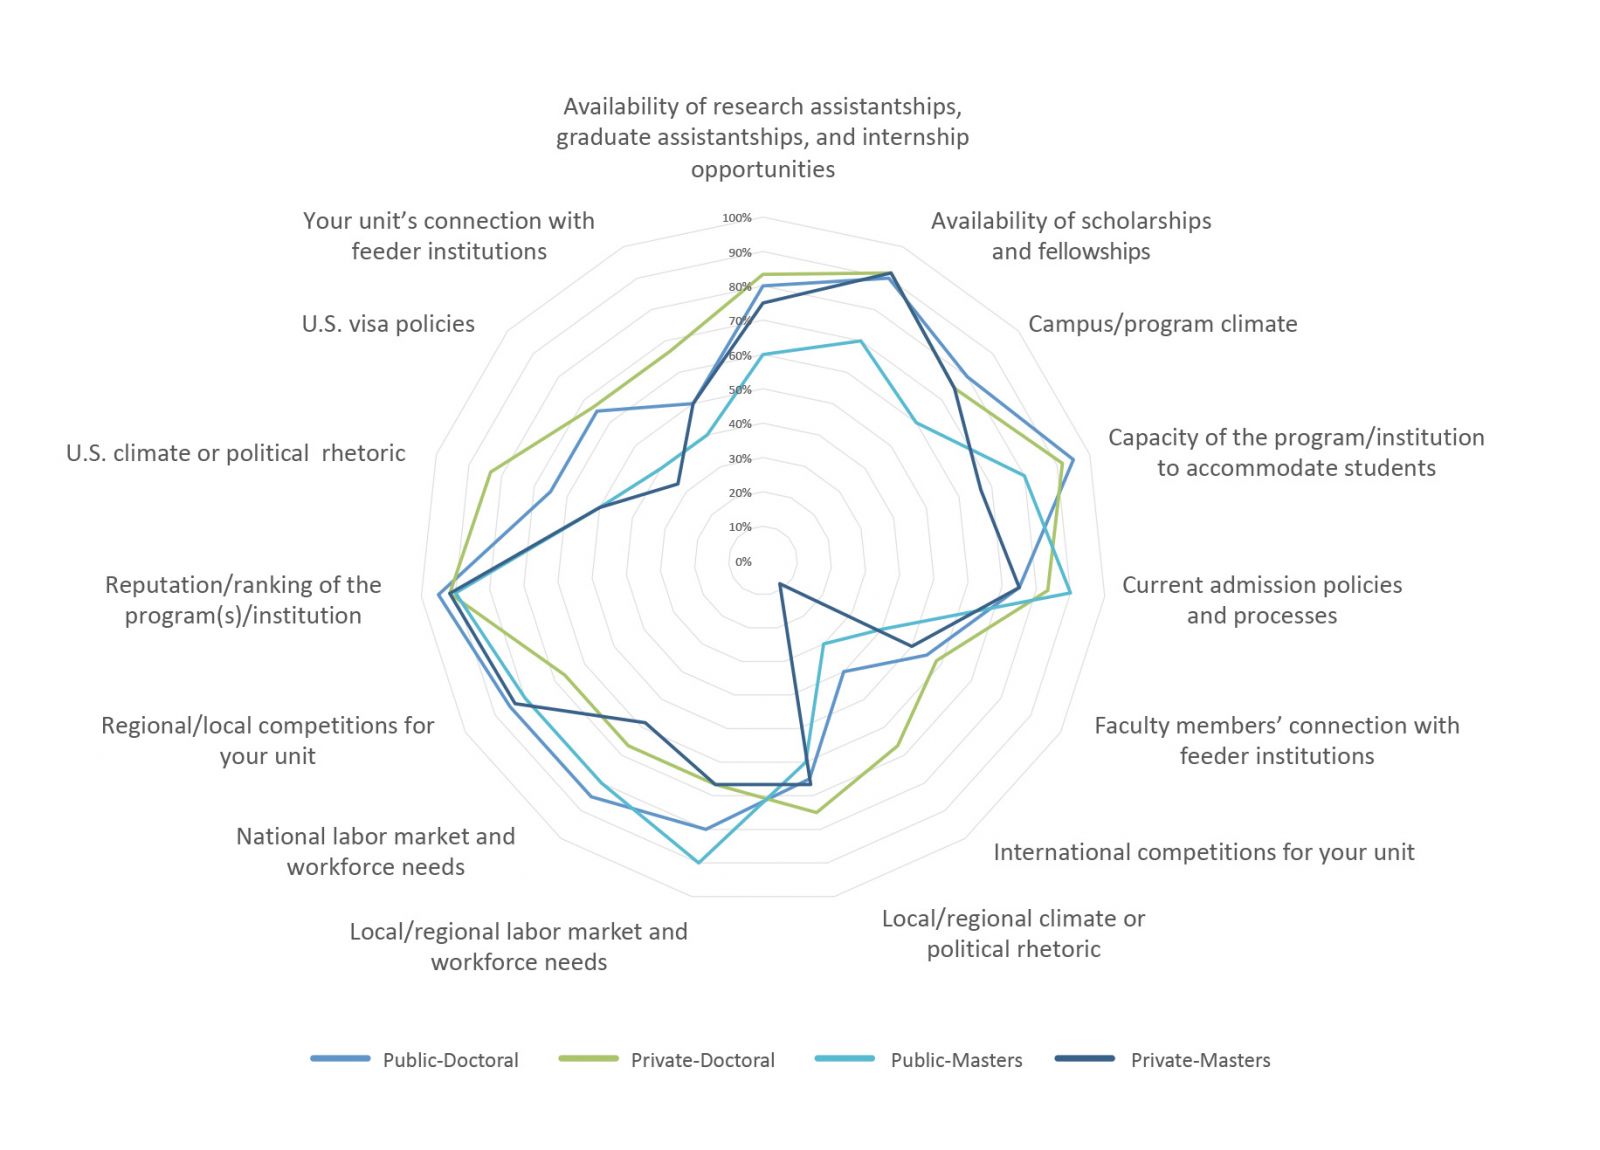
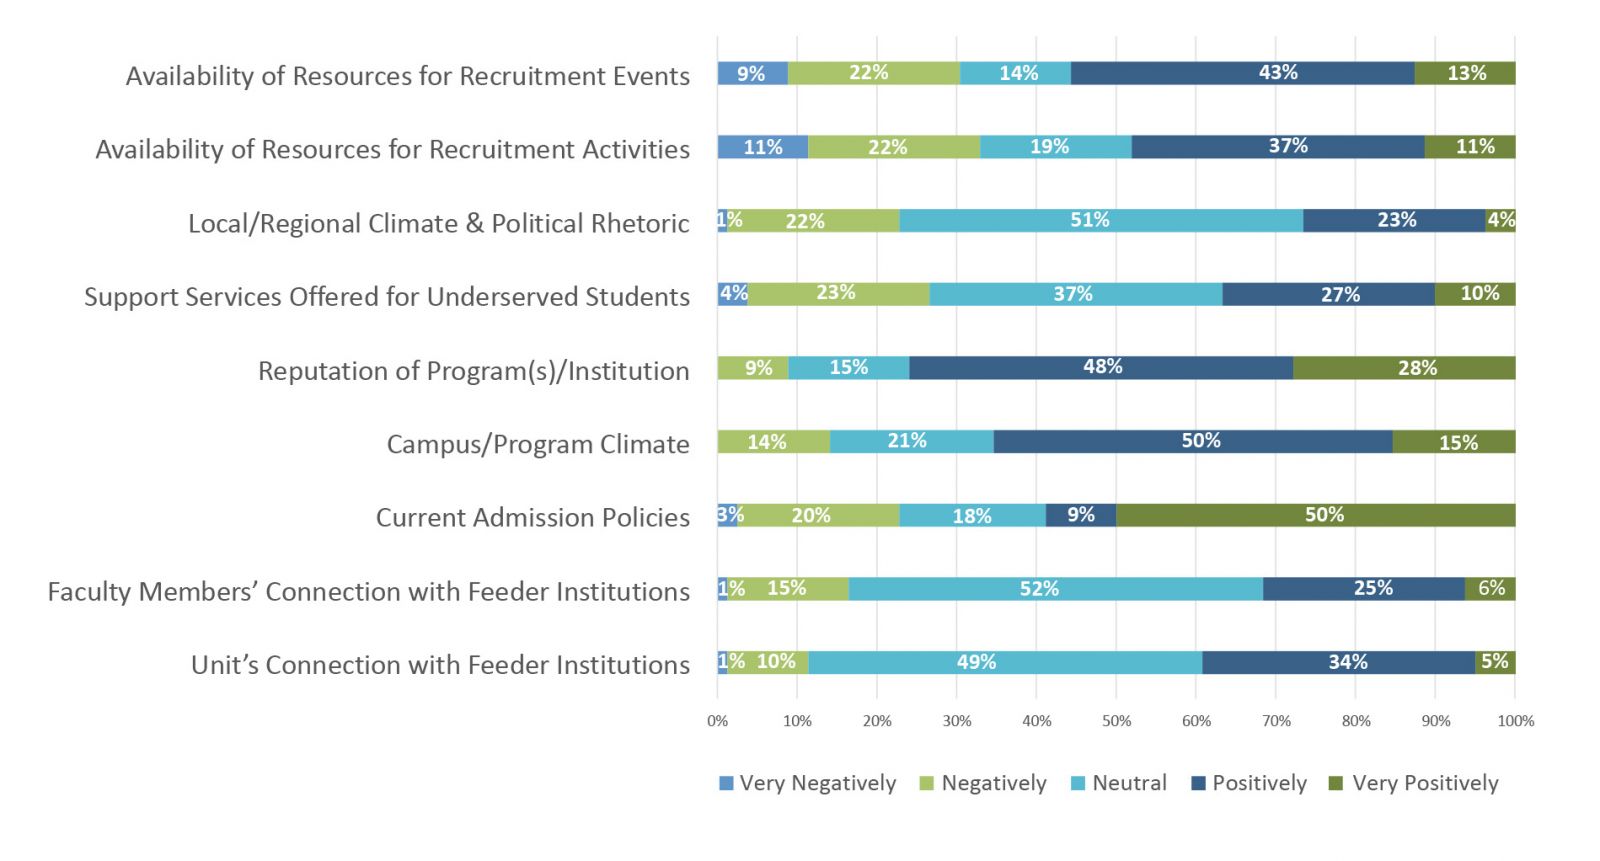
To gain insights about how graduate schools and programs are working to respond to this growing need for graduate degree holders, CGS collaborated with NAGAP, the Association for Graduate Enrollment Management to survey graduate enrollment management (GEM) professionals at U.S. and Canadian based institutions. Of the 167 respondents to the survey, 47.3% of GEM professionals reported that their institution or program has a robust enrollment growth target - 10% or more. In this brief, we discuss some of the insights gathered from this survey of GEM professionals.
Key Findings
Figure 1.
Data Source: NAGAP, The Association for Graduate Enrollment Management & Council of Graduate Schools, Survey of Graduate Enrollment Management Professionals, Summer 2019.
Table 1.
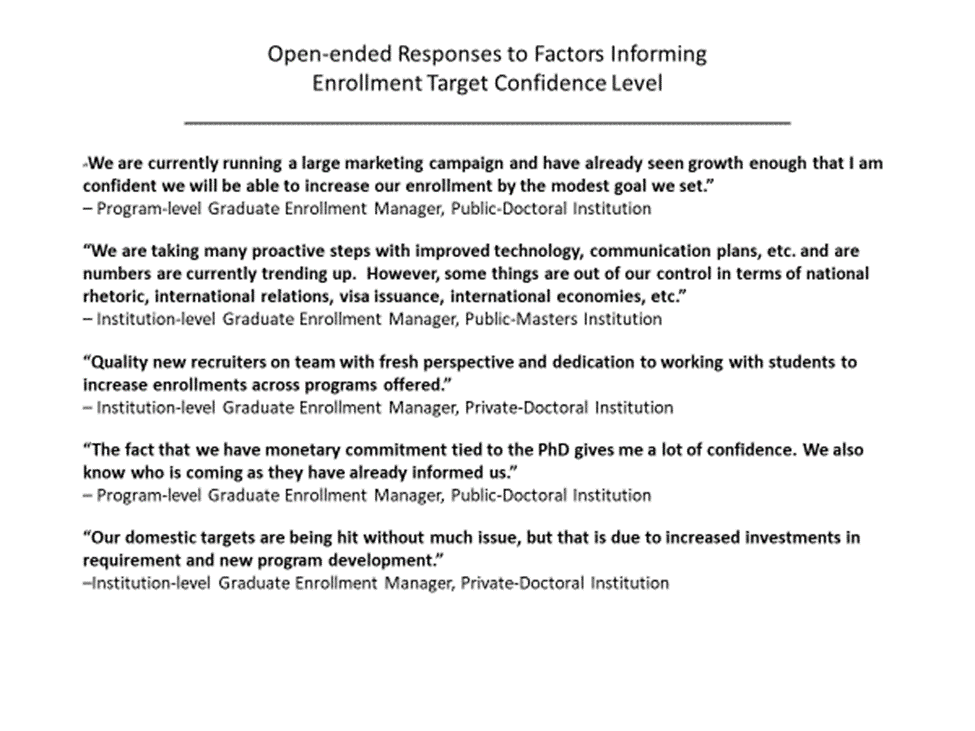
Figure 2.
Data Source: NAGAP, The Association for Graduate Enrollment Management & Council of Graduate Schools, Survey of Graduate Enrollment Management Professionals, Summer 2019.
Takeaway Points
Conversation Starters for Graduate Deans
Additional Resources
References:
Okahana, H., & Zhou, E. (2019a). Graduate enrollment and degrees: 2008 to 2018. Washington, DC: Council of Graduate Schools.
Okahana, H., & Zhou, E. (2019b). International graduate applications and enrollment: Fall 2018. Washington, DC: Council of Graduate Schools.
U.S. Bureau of Labor Statistics. (2019). Table 5.2 Employment, wages, and projected change in employment by typical entry-level education (Employment in thousands). Retrieved from https://www.bls.gov/emp/tables/education-summary.htm.
About the Data Source:
The 2019 NAGAP/CGS Survey of Graduate Enrollment Management Professionals was developed by CGS, in consultation with NAGAP, and sent out to NAGAP members throughout July – August 2019. This brief is based on the deidentified, individual-level data file of 167 respondents. 91% of respondents voluntarily identified their institution and institutional characteristics were added to the data file using 2015 Carnegie Classification information. Analysis for this brief is based on a sample of 47.3% (N=79) institutions identifying a goal to increase overall enrollment by 10% or higher. These institutions break out into public Doctoral institutions (N=20), private Doctoral (N=12), public Masters institutions (N=10), and private Masters institutions (N=10).
Author Contribution and Acknowledgment
The brief was prepared by Hironao Okahana and Christian P.L. West. H.O. conceived and designed the project and data collection instrument, as well as supervised the analysis for this work. C.W. performed data cleaning and analysis, prepared the figures and table. Both authors discussed and contributed to the final brief. Suzanne T. Ortega, Enyu Zhou, Radomir Ray Mitic, and Janet Gao also provided feedback to earlier drafts of the brief. NAGAP, The Association for Graduate Enrollment Management provided feedback to earlier versions of the data collection instrument and administered the survey to its members. Any opinions, findings, and conclusions or recommendations expressed in this brief do not necessarily reflect the views of NAGAP.
November 2019
The Council of Graduate Schools (CGS) is a member association of over 480 U.S. and Canadian colleges and universities. Member universities vary in size, scope, and way that graduate programs are organizing and administering. Based on responses from the 200 universities that participated in the 2019 CGS Survey of Organization & Administration of Graduate Education, this brief provides selected insights into how graduate education is organized and administered in the U.S. and Canada. The finding affirms that the majority of responding institutions organizes the responsibilities of graduate education within an organizational unit led by a dean. This organizational structure provides graduate education administrators with leadership roles that are similar in stature and expectations to those of academic colleges and collegiate deans. We also found that in addition to supporting graduate student success, the organizations responsible for graduate education, particularly at research-intensive institutions, also oversee postdoctoral trainees.
October 2019
According to the Council of Graduate Schools (CGS), applications for admission to master’s programs increased by 1.4% and for doctoral programs by 4.1% between Fall 2017 and Fall 2018, while first-time enrollment in these programs grew by 2.0% and 2.9%, respectively (Okahana & Zhou, 2019a). Despite recent declines in international graduate enrollment (Okahana & Zhou, 2019a & 2019b), overall graduate enrollment at U.S. colleges and universities continues to grow, albeit modestly. This is not surprising as workforce demands for graduate degree holders are still growing in the United States. Jobs that require master’s degrees and doctoral degrees at the entry are expected to rise by 13.7% and 9.0% between 2018 and 2028, respectively (U.S. Bureau of Labor Statistics, 2019).
Career Pathways Brief: Job Changes of PhD Graduates After Earning Their Degree
July 2019
Relatively little is known about the job transitions PhD degree holders experience at various stages of their careers. Using data from the Council of Graduate Schools’ Understanding PhD Career Pathways for Program Improvement project, this brief looks into current and immediate prior jobs of PhD degree holders who earned their doctorates three years (Cohort A), eight years (Cohort B), and fifteen years (Cohort C) ago. We examined the nature of job transitions that occurred within the last three years.
Career Pathways Brief: How Well Did a STEM PhD Train Degree Recipients for Their Careers?
April 2019
The vast majority of STEM PhDs work in fields related to their doctoral education and are satisfied with their jobs. According to the National Science Foundation's (NSF) Survey of Doctoral Recipients, 92% of employed doctoral scientists and engineers in 2017 held jobs that are closely or somewhat related to their PhDs (NSF, 2019). Using data from the Council of Graduate Schools’ (CGS) PhD Career Pathways project, this brief provides new insight into how STEM PhDs apply their doctoral training in the workforce.
PRESS RELEASE
EMBARGOED UNTIL: October 8, 2019, 12:01 a.m. EDT
CONTACT: Katherine Hazelrigg / (202) 461-3888 / khazelrigg@cgs.nche.edu
Washington, DC — Today the Council of Graduate Schools (CGS) reported that graduate applications (2.2%) and first-time graduate enrollment (2.1%) increased overall and across all institution types (Doctoral Highest, Higher, and Moderate Research Institutions and Master’s Colleges and Universities) for Fall 2018. While the overall numbers are on the rise, first-time graduate enrollment of international students continues to decline (-1.3%). The data are part of the latest CGS/GRE Graduate Enrollment & Degrees: 2008-2018 report.
“The increases in application and first-time enrollment rates for Fall 2018 after last year’s slowdown is encouraging news for graduate education. We’re especially pleased to see increases in first-time enrollment among Latinx (6.8%), Black/African American (3.5%), Asians/Pacific Islander (6.2%), and American Indian/Alaska Native (8.3%) graduate students,” said CGS President Suzanne Ortega. “However, we do take note of the continued decline in the number of international students pursuing graduate education in the U.S. As we move to an increasingly globalized economy and workforce, domestic students benefit from training alongside international students, who also make important contributions to graduate education and research and the U.S. economy.”
Enrollments Continue to Align with Fastest Growing Fields
Enrollment trends by broad field of study are consistent with data from the last two years. Between Fall 2017 and Fall 2018, the largest one-year gains in first-time enrollment by broad field of study were in mathematics and computer sciences (4.3%), health sciences (3.3%), and education (3.2%). In contrast, applications and first-time graduate enrollment in engineering over the same period declined 6.9% and 4.6%, respectively. These results are consistent with findings from CGS’s International Graduate Applications and Enrollment: Fall 2018 survey, indicating that the decline in engineering enrollment is largely driven by a decrease in international students.
“Between Fall 2008 and Fall 2018, first-time graduate enrollment in mathematics and computer sciences has increased 11.0% and health sciences by 6%. Based on our data, these are the fastest-growing fields in graduate education and many jobs within them require advanced degrees,” said Ortega. “The steady growth in first-time enrollment in these fields indicates graduate education’s continued alignment with recent Bureau of Labor Statistics data on employment projections. These findings suggest that incoming students recognize the expanding employment opportunities in these growing fields, as well as the role they play in driving innovation.
Institutions responding to the CGS/GRE Survey of Graduate Enrollment & Degrees for Fall 2018 enrolled more than 1.8 million graduate students. Nearly three-quarters (73.9%) of total graduate enrollment was in master’s programs. Over one million of those graduate students, or 58.2%, were women. The three largest broad fields of study (business, education, and health sciences) were also the fields with the largest proportions of part-time graduate students (Business: 62.9%; Education: 51.2%; Health Sciences: 41.5%).
Other report findings are summarized below.
Findings by Broad Field
Findings by Degree Level
Findings by Student Demographics
About the report
Graduate Enrollment and Degrees: 2008 to 2018 presents the findings of an annual survey of U.S. graduate schools, co-sponsored by CGS and the Graduate Record Examinations (GRE) Board. It is the only annual national survey that collects data on graduate enrollment by all fields of study and is the only source of national data on graduate applications by broad field of study. The report includes responses from 589 institutions and presents statistics on graduate applications and enrollment for Fall 2018, degrees conferred in 2017-18, and trend data for one-, five- and ten-year periods.
###
The Council of Graduate Schools (CGS) is an organization of approximately 500 institutions of higher education in the United States and Canada engaged in graduate education, research, and the preparation of candidates for advanced degrees. The organization’s mission is to improve and advance graduate education, which it accomplishes through advocacy in the federal policy arena, research, and the development and dissemination of best practices.
Highlights from the 2018 CGS/GRE Survey of Graduate Enrollment & Degrees
September 24, 2019
A preview of the 2018 Graduate Enrollment & Degree survey results, which was released to the public on October 8, 2019, was presented, including the latest trends in applications for admission to graduate school, first-time and total graduate student enrollment, and graduate degrees and certificates conferred.
Learning Analytics in Higher Education: Scope, Use, and Implications
March 28, 2019
Educational big data, also known as learning analytics, are innovating higher education. The power of learning analytics lies in their ability to illuminate previously unseen trends in student learning and engagement and provide real-time, personalized feedback. However, the data and algorithms that underlie learning analytics-based tools do not come without controversy. Concerns related to ethics and privacy violations, including algorithmic bias, lack of transparency in proprietary tools, surveillance and tracking of students, and data access, protection, and ownership have created the need for careful use of these data and thoughtful policies to govern that use. For graduate programs in data science that focus on educational big data, foundations in ethics and privacy of data use should be a core component of curriculum. These programs should help shed light on not just the potential that learning analytics offer, but the inherent problems associated with big data correlations that can result in data-driven, versus data-informed, decision making.
Graduate Enrollment Trends at Hispanic Serving Institutions (HSIs)
June 10, 2019
Hispanic Serving Institutions (HSIs) are colleges and universities that enroll 25% Latinx undergraduate students. HSIs now represent about 17% of all postsecondary institutions in the United States, and they enroll about 66% of all Latinx enrolled in college. They are an important and growing segment of the postsecondary population. Yet there is little understanding of what it means to serve Latinx undergraduates at HSIs, and even less emphasis on graduate enrollment. Using descriptive analyses and data from IPEDS, Dr. Garcia found enrollment inequities between Latinx undergraduate and graduate students at HSIs, calling to question, “What does it mean for HSIs to serve graduate students?” Using findings from a recent study published in the Journal of Hispanic Higher Education, Dr. Garcia will discuss the increasing significance of HSIs are graduate serving institutions, arguing that they can become primary educators of a diverse, highly educated workforce.
Contact: Katherine Hazelrigg (202) 461-3888 / khazelrigg@cgs.nche.edu
Master’s and Certificate Programs Remain Most Affected
Washington, DC —New data from the Council of Graduate Schools (CGS) reveal that for the second consecutive year, international graduate application and first-time enrollment rates declined at U.S. universities. For Fall 2018, the final application counts from prospective international students declined by 4%, while the first-time enrollment of international graduate students declined by 1%.
The overall decline is primarily driven by a 6% decrease in applications and a 2% decrease in first-time enrollment to master’s and certificate programs. In contrast, first-time international doctoral enrollment grew by 3%. The discrepancy by degree objective is notable given the proportion of first-time international graduate enrollment in master’s and certificate programs (77%) vs. doctoral programs (23%).
“This is the first time we’ve seen declines across two consecutive years, and while we think it’s too soon to consider this a trend, it is troubling,” said CGS President Suzanne Ortega. “We continue to monitor issues, including changes in immigration and visa policy, with growing concern over the possible negative impact to the U.S.’s image as a welcoming destination for international students and scholars.”
Highlights by Country of Origin
China and India continue to represent the largest shares of international graduate applications, first-time international graduate enrollment, and total international graduate enrollment. However, the final application and first-time graduate enrollment of Indian students experienced large decreases again (-12%, -2% respectively) during the Fall 2017 to Fall 2018 admission cycle. This is the second consecutive year the number of applications and first-time enrollment from India has declined.
Graduate applications from Middle Eastern & North African students to U.S. graduate schools fell by 14% between the Fall 2017 and Fall 2018 admission cycles. Graduate applications and first-time enrollment of Iranian (-27%, -8%) and Saudi Arabian (-6%, -21%) graduate students also decreased. Conversely, applications and first-time enrollment of Sub-Saharan African graduate students increased by 28% and 5% respectively.
Ortega noted that overall, admission yield rates are comparable to last year. “This suggests that prospective international graduate students remain highly likely to accept offers of admission to U.S. graduate schools.”
Highlights by Field of Study
Across broad fields of study, international graduate applications increased in health sciences (5%), mathematics and computer sciences (6%), and other fields (8%) between Fall 2017 to Fall 2018. By contrast, engineering (-16%), physical & earth sciences (-9%), and business (-8%) experienced decreases in international graduate applications during this period. Business (95%), public administration & services (86%), and mathematics & computer sciences (85%) had high concentrations of first-time international students in master’s and certificate programs in Fall 2018, while first-time doctoral students accounted for 77% of international graduate students in physical & earth sciences and 50% in biological & agricultural sciences.
About the survey and report
Conducted since 2004, the CGS International Graduate Admissions Survey tracks the applications and enrollments of international students seeking U.S. master’s and doctoral degrees. As the only report of its kind to offer data on the current academic year, International Graduate Applications and Enrollment: Fall 2018 reports applications, admissions, and enrollments of international master’s, certificate, and doctoral students at U.S. colleges and universities. In Fall 2016 the survey was redesigned to collect data by degree objective (master’s and graduate certificate vs. doctorate), and for all seven regions of origin, eight countries of origin, and all eleven broad fields of study, yielding the only degree-level data currently available for graduate admissions and enrollments. 369 U.S. graduate institutions who are members of CGS or its regional affiliates responded to the 2018 survey.
# # #
The Council of Graduate Schools (CGS) is an organization of approximately 500 institutions of higher education in the United States and Canada engaged in graduate education, research, and the preparation of candidates for advanced degrees. The organization’s mission is to improve and advance graduate education, which it accomplishes through advocacy in the federal policy arena, research, and the development and dissemination of best practices.
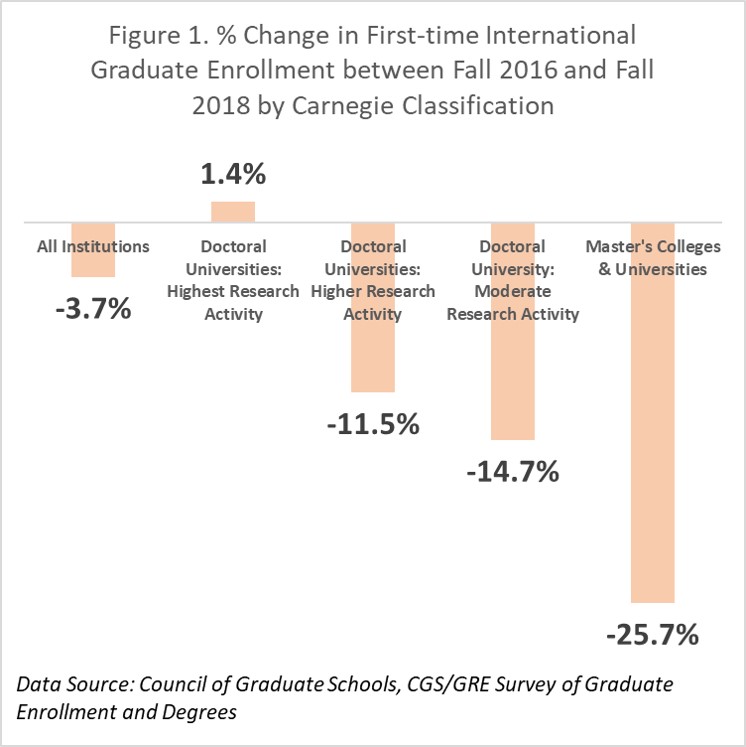
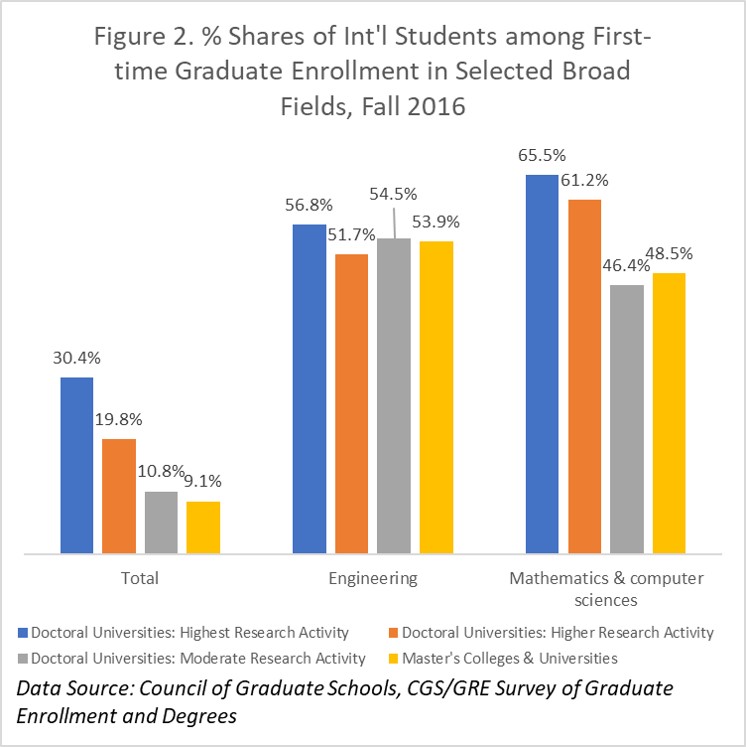
Hironao Okahana, Associate Vice President, Research & Policy Analysis & Enyu Zhou, Education Research Analyst, Council of Graduate Schools
According to the 2018 CGS/GRE Survey of Graduate Enrollment and Degrees (GE&D), first-time graduate enrollment of international students at participating institutions declined by 3.7% between Fall 2016 and Fall 2017. This brief highlights some additional analysis pertaining to international graduate enrollment trends.
Key Findings:
Takeaway Points:
Conversation Starters: What do these data points mean for your graduate school and your programs and their strategic directions?
Additional Resource:
CGS Strategic Consultations. The Council of Graduate Schools provides strategic consultations to member and nonmember institutions, boards, and state agencies as they make tactical decisions about the administration of graduate education. Our consultations draw upon extensive best practice and benchmarking research as well as the insights of experienced graduate deans from around the country. CGS also provides Custom Data Reports to help institutional leaders inform their strategic decision-making processes. Figures and tables in this brief and the full GE&D report can be customized to include institutions of your choice.
About the Data Source:
CGS/GRE Survey of Graduate Enrollment and Degrees is an annual survey of U.S. graduate schools, co-sponsored by CGS and the Graduate Record Examinations (GRE) Board since 1986. It is the only annual national survey that collects data on graduate enrollment by all fields of study and is the only source of national data on graduate applications by broad field of study. The report includes responses from 619 institutions and presents statistics on graduate applications and enrollment for Fall 2017, degrees conferred in 2016-17, and trend data for one-, five- and ten-year periods.
The brief was prepared by Hironao Okahana and Enyu Zhou. Ryan Bradshaw and Katherine Hazelrigg also contributed. Any opinions, findings, and conclusions or recommendations expressed in this brief do not necessarily reflect the views of CGS.
For 2018, we are pleased to be offering two formats to submit data:
1) Excel 2018 Data Submission Instrument (preferred)
2) PDF 2018 Data Submission Instrument
For both data submission formats, please use the 2018 International Graduate Applications and Enrollment Survey Instructions and Definitions as your guide to completing the instruments and submitting your data.
Data collection is open until Friday, November 9, 2018.
We appreciate your time in completing the survey instruments.
2017 International Graduate Admissions and Survey Data Submission
If you did not submit data to the 2017 International Graduate Applications and Enrollment Survey, please consider submitting it at this time. Having institutional data from both years allows your institution's data to be used in additional statistics, including the calculation of year-over-year yield rates.
To submit 2017 data, please use the Excel 2017 Data Submission Instrument. Utilize the same instructions as the 2018 Survey to complete the document. To submit your 2017 data to CGS:
Contact
For more information about the CGS International Graduate Admissions Survey, please contact Hironao Okahana.
PRESS RELEASE
EMBARGOED UNTIL: October 3, 2018, 12:01 a.m. EDT
Contact: Katherine Hazelrigg / (202) 461-3888 / khazelrigg@cgs.nche.edu
Washington, DC — Today the Council of Graduate Schools (CGS) reported that growth in first-time graduate enrollment remains flat, according to its most recent data, while the number of graduate applications to U.S. universities has decreased. Between Fall 2016 and Fall 2017, first-time graduate enrollment dropped by -0.1% and the number of applications for admission to U.S. graduate schools decreased -1.8%. Although the overall number of applications for admission declined, several broad fields of study saw increases, including business (4.5%), public administration and services (1.9%), education (1.8%), and mathematics and computer sciences (1.7%). The data is part of the latest CGS/GRE Graduate Enrollment & Degrees: 2007-2017 report.
Decrease in International Enrollments
First-time graduate enrollment for U.S. citizens and permanent residents increased 1.1% between Fall 2016 and Fall 2017. In contrast, first-time graduate enrollment of international students decreased -3.7%, but the five-year (4.7%) and ten-year average annual increase (5.6%) rates remain strong. Universities with an R1 Carnegie Classification, or highest research doctoral institutions, saw no negative impacts, posting a 3.0% increase between Fall 2017 and Fall 2017.
“The decrease in application and flat first-time enrollment rates are not unexpected given the robust economy and job market. After years of steady growth, the slow down aligns with typical cycles in the economy,” said CGS President Suzanne Ortega. “What is worrisome, however, is the decline in the number of international students pursuing graduate education in the U.S. The 3.7% drop in first-time enrollment between Fall 2016 and Fall 2017 is the second consecutive decrease we’ve seen since 2003. While it is difficult to pinpoint what caused the decline, the current policy climate around U.S. visas and immigration may be a contributing factor.”
Enrollments Align with Fastest Growing Fields
Enrollment trends by broad field of study are consistent with last year. The largest one-year gains in first-time enrollment by broad field of study were in mathematics and computer sciences (3.8%) and business (3.7%) between Fall 2016 and Fall 2017. The largest five- and ten-year average (2012-2017) percent changes by broad field were in mathematics and computer sciences (12.8%, 12.1%) and the health sciences (4.0%, 6.9%). In contrast, the one-year change in first-time graduate enrollment in engineering was -3.8%, compared to -0.9% between Fall 2015-2016; engineering also posted the biggest application decline in the one-year period (-7.3%). These results are consistent with CGS’s International Graduate Applications and Enrollment: Fall 2017, indicating that the decline in engineering enrollment is largely driven by a decrease in international students.
“The continued growth in applications and first-time enrollment in the health sciences indicates graduate education is aligning with the increasing workforce demand for advanced degree holders,” said Ortega. “According to the most recent Bureau of Labor Statistics data on employment projections, many of the fastest growing fields are in mathematics and computer sciences and the health sciences, including physician assistants, occupational therapists, mental health and substance abuse social workers, mathematicians, and computer and information research scientists. These jobs all require at least a master’s degree for a typical entry-level position.”
Institutions responding to the CGS/GRE Survey of Graduate Enrollment & Degrees for Fall 2017 enrolled more than 1.8 million graduate students. Nearly three quarters (74.0%) of total graduate enrollment was in master’s programs. Over one million of those graduate students, or 57.9%, were women. Academic year 2016-17 marked the eighth consecutive year in which women earned the majority of degrees awarded. However, in many STEM fields, men still earned the majority of graduate degrees and certificates.
Other report findings are summarized below.
Findings by Broad Field
Findings by Degree Level
Findings by Student Demographics
About the report
Graduate Enrollment and Degrees: 2007 to 2017 presents the findings of an annual survey of U.S. graduate schools, co-sponsored by CGS and the Graduate Record Examinations (GRE) Board. It is the only annual national survey that collects data on graduate enrollment by all fields of study and is the only source of national data on graduate applications by broad field of study. The report includes responses from 619 institutions and presents statistics on graduate applications and enrollment for Fall 2017, degrees conferred in 2016-17, and trend data for one-, five- and ten-year periods.
###
The Council of Graduate Schools (CGS) is an organization of approximately 500 institutions of higher education in the United States and Canada engaged in graduate education, research, and the preparation of candidates for advanced degrees. The organization’s mission is to improve and advance graduate education, which it accomplishes through advocacy in the federal policy arena, research, and the development and dissemination of best practices.
![]()