

Thank you for visiting CGS! You are currently using CGS' legacy site, which is no longer supported. For up-to-date information, including publications purchasing and meeting information, please visit cgsnet.org.
Benchmarking

CGS is the leading source of information, data analysis, and trends in graduate education. Our benchmarking data help member institutions to assess performance in key areas, make informed decisions, and develop plans that are suited to their goals.
Hironao Okahana, Assistant Vice President, Research & Policy Analysis
It’s that time of year again! The NSF’s National Center for Science and Engineering Statistics (NCSES) has released the latest Survey of Earned Doctorates (SED) data tables. SED is the comprehensive source of information about newly-minted research doctorates since 1957, collecting the annual census of this population. The higher education community monitors this survey with keen interest, as the SED data is often used as a key national indicator of doctoral education in the United States. The latest release of the data is based on those students who earned research doctorates between July 1, 2014 and June 30, 2015. While the full NSF report is forthcoming, we have already seen the following headlines in leading media outlets for the higher education community: The New Ph.D.s: New federal data show American universities awarded a record number of Ph.D.s in 2015 and Economic Realities Have Altered Ph.D. Recipients’ Plans for Future. This article offers a quick look at statistics from the latest data release of SED compiled by the CGS research team. Full data tables are available on the NSF website and table numbers referenced in this article correspond to the web tables.
In the 2014/15 academic year, 55,006 earned research doctorates from U.S. institutions, and a little less than two-thirds of them (64%) were U.S. citizens and permanent residents. Among U.S. citizens and permanent residents, women continue to hold the majority of earned doctorates (51%); however, only a little over one-third (36%) of international doctorates were earned by women. The overall share of international degree recipients among all earned doctorates has been relatively stable over the last decade, while the number of earned doctorates has grown steadily (Table 18). In the past seven years, about 70% of international doctoral recipients intended to stay in the United States after earning their degrees (Table 53). Interests vary substantially by their countries of origin. For example, Saudi Arabian (14%) and Thai (21%) students were least likely to intend to stay in the United States after earning their doctorates. Of those students from the two top countries of origin for earned doctorates with a temporary visa, China and India, more than 80% of earned doctorates intended to stay in the United States.
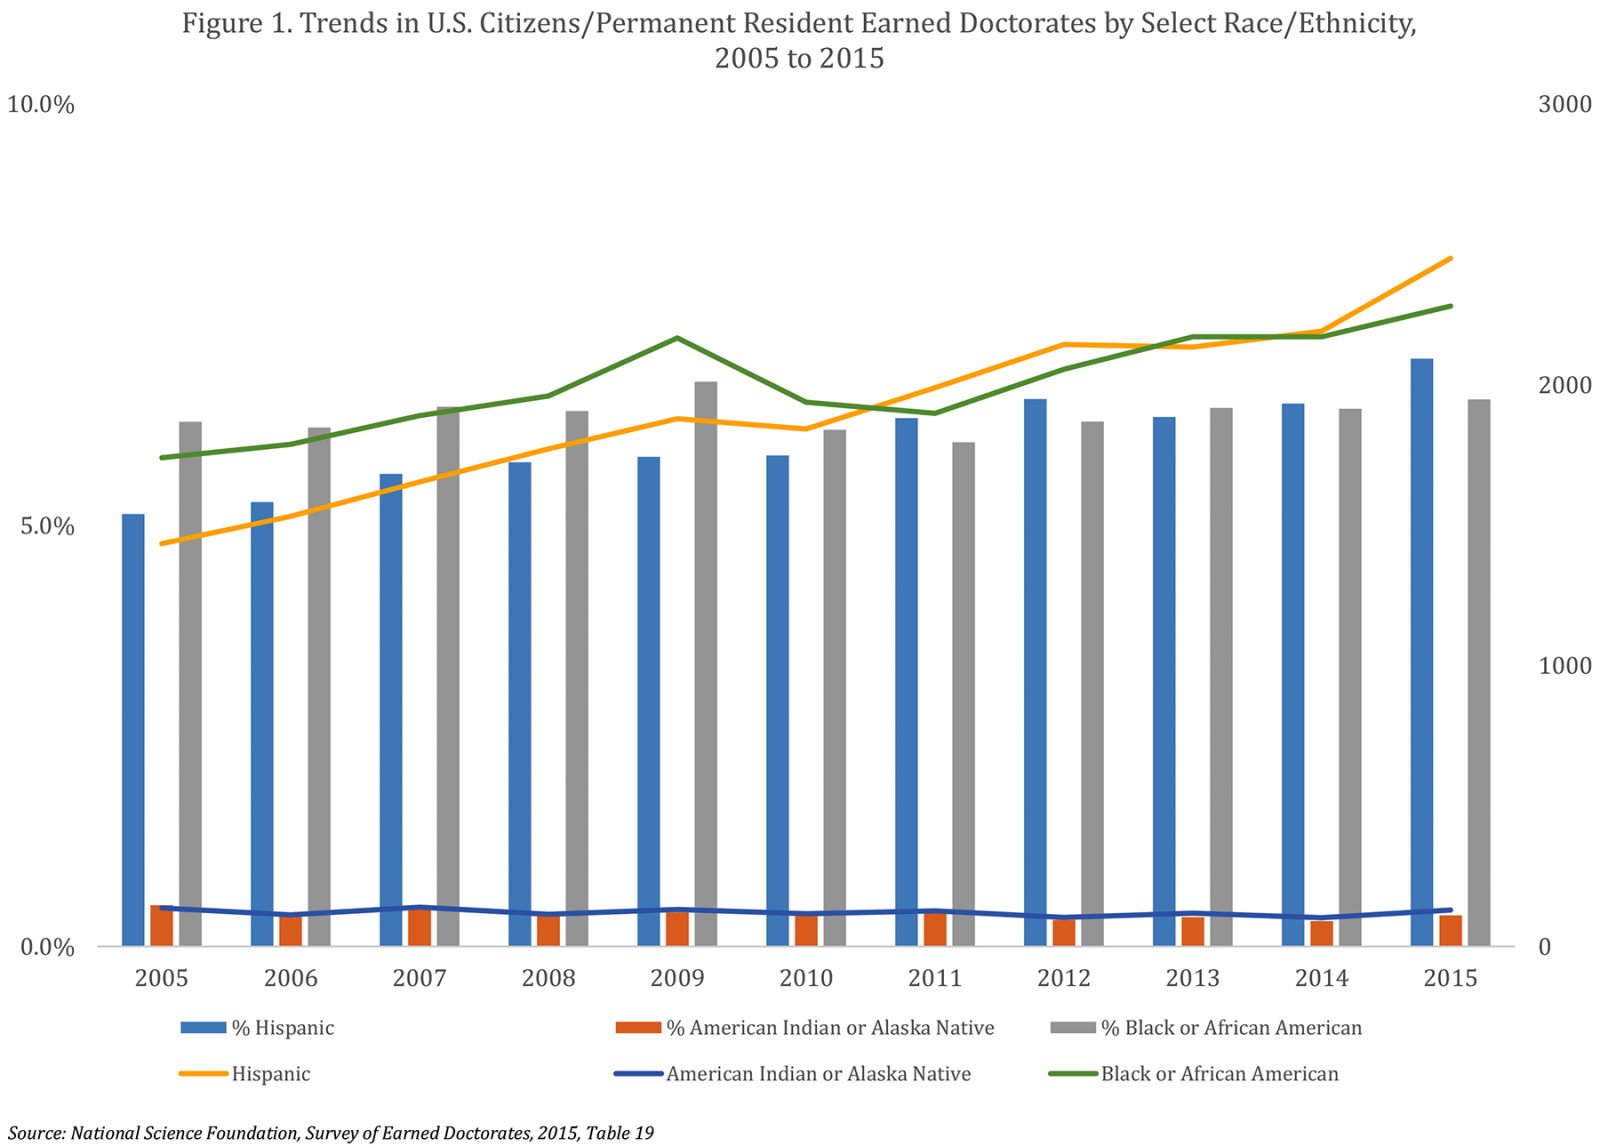
Over the last decade, an increasing number of underrepresented minority (URM) students have earned research doctorates from U.S. institutions. Table 19 shows that during the 2014/15 academic year, record-breaking numbers of U.S. citizens and permanent residents of Hispanic/Latino heritage (2,451) and of Black/African American background (2,281) earned research doctorates. Also the number of earned doctorates by American Indian/Alaska Native students was the second highest in the last decade. While these are encouraging signs to achieving greater access and inclusivity in doctoral education, relative shares of these URM students have continued to stagnate (See Figure 1). Among U.S. citizens and permanent residents, American Indian/Alaska Native students have less than a 0.5% share of earned doctorates with 7.0% and 6.5% shares respectively for Hispanic/Latino students and Black/African American students. Facilitate more diversity in doctoral education will therefore remain a priority for the graduate education community.
A notable new statistic included in this latest data release was median times to doctorate since starting a doctoral program (Table 31). In the prior iterations, median times to doctorates were only reported as times since starting any graduate school and since earning bachelor’s degrees. The inclusion of this new data point offers the most precise national benchmark for doctoral time-to-degree. Overall, the median time to earning a doctorate since starting a doctoral program was 5.7 years, with the longest time-to-degree being 6.9 years for humanities and arts and the shortest time-to-degree being 5.2 years for engineering.
A little over two-thirds (68%) of doctoral recipients also hold a master’s degree, though not necessarily in related fields (Table 29). About 1 in 5 of those who hold a master’s degree earned a degree in a field not related to their doctorates. American Indian/Alaska Native (82%) and Black/African American (84%) students were particularly likely to have earned master’s degrees, suggesting that master’s programs are an important pathway for URM students leading to doctoral education. Interestingly, of those Black/African American students who earned master’s degrees, 3 in 10 hold a master’s degree in fields not related to their doctorates. Master’s attainment was the lowest in life science fields (49%), followed by physical science and earth science fields (51%), while it was the highest in education (86%), humanities and arts (83%), and psychology and social sciences fields (81%). Consequently, earned doctorates from these three fields had the longest times to doctorate since earning a bachelor’s degree, 14.8 years, 11.0 years, and 9.3 years, respectively. Also, about 1 in 5 U.S. citizens and permanent residents who earned research doctorates attended community college (Table 30).
Each year, the Survey of Earned Doctorates offers a wealth of information about the individuals who completed their doctorates in the United States. We encourage you to check out data tables as a benchmarking resource. Each institution also receives an individualized data report from NSF that includes some comparative national data, and institutions can contact NSF to obtain micro data for earned doctorates from their institutions. If you have not taken advantage of these data resources, we highly encourage you to do so, and add them to your go-to data points to support program improvement.
Data Sources: Four out of Five: A Closer Look into Master’s Degrees
October 2017
A large majority of graduate students in the United States pursue master’s degrees. According to the most recent CGS/GRE Survey of Graduate Enrollment and Degrees (GE&D), more than twice as many applications for admission were submitted to master’s programs than doctoral programs, and four out of five first-time graduate students enrolled in Fall 2016 were enrolled in programs leading to a master’s degree or a graduate certificate. Furthermore, the large majority (83%) of degrees awarded in 2015-16 were master’s degrees, while the share of doctoral degrees was 11% and graduate certificates was 6.2%. The sheer size of the student body and degrees awarded make master’s education a critical part of the graduate education enterprise that affects institutional missions, enrollment models, and financial planning across different sectors of higher education. This article highlights several results from the most recent GE&D survey that pertain specifically to master’s education.
Data Sources: Admission Yields of Prospective International Graduate Students: A First Look
July 2017
With nearly one out of five U.S. master’s and doctoral students being international students, the Council of Graduate Schools (CGS), graduate deans, and graduate education community has a high stake in supporting the recruitment and success of international graduate students and scholars pursuing their studies in the United States. Though it has been over five months since the first immigration executive order was signed, much uncertainty still remains as to how the current political climate and immigration policies may be affecting that flow. A short survey conducted by CGS finds that member deans are seeing a decline in admission yields of prospective international graduate students, a sign that the global appeal for U.S. graduate education may be suffering.
Data Sources: Highlights from the 2017 CGS Pressing Issues Survey
April 2017
The CGS Pressing Issues Survey is an important vehicle for the Council of Graduate Schools (CGS) to stay apprised of the key priorities for our member deans. The 2017 survey was administered to all 485 graduate deans or equivalent at CGS member institutions based in the U.S. and Canada via email between February 1 and February 17, 2017. The response rate was 42%, with 205 institutions recording their survey responses. The survey asked a range of questions regarding priorities for graduate deans, graduate schools, and their home institutions for the upcoming twelve months, as well as observations of graduate application trends. This article provides insights into three key areas: graduate application trends, advocacy, and diversity.
Data Sources: A Quick Look into the Latest Survey of Earned Doctorates Data
January 2017
It’s that time of year again! The NSF’s National Center for Science and Engineering Statistics (NCSES) has released the latest Survey of Earned Doctorates (SED) data tables. SED is the comprehensive source of information about newly-minted research doctorates since 1957, collecting the annual census of this population. The higher education community monitors this survey with keen interest, as the SED data is often used as a key national indicator of doctoral education in the United States. his article offers a quick look at statistics from the latest data release of SED compiled by the CGS research team. Full data tables are available on the NSF website and table numbers referenced in this article correspond to the web tables.
Data Sources: Preliminary Data Indicate Growth in Domestic First-Time Graduate Enrollment
December 2015
Although the focus of the CGS International Graduate Admissions Survey is on the participation of international students in US graduate schools, the 2015 survey also asked respondents to provide preliminary data on the participation of US citizens and permanent residents. As this analysis will show, there was a 2% increase in first-time graduate enrollments among US citizens and permanent residents between Fall 2014 and Fall 2015.
Data Sources: Graduate Student Debt Data: What We Can and Cannot Tell
November 2015
Student debt has become a dominant topic of discussion in graduate education in recent years. The topic of graduate student financial support has also been consistently noted as one of the chief concerns among CGS member graduate deans (Allum, 2014); however, as the circumstances vary by each and every campus, there is no single data point or figure that can fully capture the condition of graduate student debt. More detail is the key to shedding some light on this issue, and graduate deans wishing to explain the state of graduate student debt on their respective campuses will need to either uncover some data on their own or in collaboration with other campus offices. This article will help do that by expanding upon an existing CGS resource, Understanding Graduate Student Debt Data (Council of Graduate Schools, 2014b), offering some specifics about the current state of graduate student debt, and posing some general questions that graduate deans might consider answering for themselves.
Data Sources: An Examination of First-time Graduate Enrollment at Doctoral Institutions
October 2015
There is little disagreement about the overall size of doctoral institutions in terms of graduate enrollment at U.S.-based institutions. According to the most recent CGS/GRE Survey of Graduate Enrollment and Degrees (Allum & Okahana, 2015), more than two-thirds (71%) of first-time graduate students enrolled in Fall 2014 were enrolled at doctoral institutions, while 25% were enrolled at master’s institutions, and 3% were enrolled at other institutions. Yet the aggregation of first-time graduate enrollment data into a single category of doctoral institutions obscures notable differences within Carnegie classifications. As this Data Sources article will illustrate, this is particularly true over the course of the past decade.
Data Sources: Trends in Engineering Reveal an Influx of International Students
August/September 2015
When examined in aggregate, it is easy to understand why data regarding graduate enrollment and degrees in the broad field of engineering should be of interest. For one, it is a large field of study.With over 150,000 graduate students enrolled in Fall 2014, the field of engineering was the largest field of study in the science, technology, engineering, and mathematics (STEM) fields, and the fourth largest field of study overall, according to the 2014 CGS/GRE Survey of Graduate Enrollment and Degrees (Allum & Okahana, in press). Engineering made up 10% of all graduate students enrolled in Fall 2014, and 9% of all degrees awarded in 2013-14. The field of engineering has also been traditionally composed largely of men. In fact, three-quarters (76%) of engineering students in Fall 2014 were men, while 24% were women, a distribution that is generally the same regardless of enrollment intensity (part-time vs. full-time) and degree objective (doctoral vs. master’s and graduate certificate).
Data Sources: Academic Program Counts: A Closer Look at Arts & Humanities
July 2015
While the CGS Graduate Enrollment & Degrees by Fine Field report (Allum, 2014b) and the American Academy of Arts & Sciences’ Humanities Indicators (2015) provide detailed information about enrollment and degrees in the arts and humanities and related disciplines, neither describe the number of academic programs available across all U.S. institutions. This article aims to supplement these resources, as well as departmental-level studies conducted in recent years (White, Chu, and Czujko, 2014; White, Ivie, and Czujko, 2009) with program-level information using data from the most recent Integrated Postsecondary Education Data System (U.S. Department of Education, 2013).
Data Sources: New Insights in Master’s Education
June 2015
Master’s education is a large component of the graduate education enterprise. Until now, however, there has been no comprehensive, national dataset capable of describing applications and enrollments of master’s students by citizenship. The CGS International Graduate Admissions Survey began collecting data on applications, offers of admission, and enrollment by citizenship and degree-objective earlier this year, and the results reveal new insight into the size and scope of master’s education.
Data Sources: Highlights from the Doctoral Initiative on Minority Attrition and Completion
May 2015
The Council of Graduate Schools (CGS) published Doctoral Initiative on Minority Attrition and Completion (Sowell, Allum, & Okahana, 2015), which discusses patterns of doctoral completion and attrition among underrepresented minority (URM) students in science, technology, engineering, and mathematics (STEM) fields, as well as the experiences of students and graduate programs related to program completion. The publication was made possible by a grant from the National Science Foundation (#1138814) as well as the participation of 21 U.S.-based CGS member institutions. The report gives the most comprehensive account of completion and attrition rates of URM STEM doctoral students in the U.S. to date. The full report is available at the CGS website, and this article highlights some of findings.
Data Sources: Trends in Degrees Awarded to International Students
April 2015
The CGS International Graduate Admissions Survey is beginning to collect data and reporting findings in ways that disaggregate applications, offers of admission, and enrollment of students according to whether their degree objective is a master’s/certificate degree or doctoral degree. Results generated by this redesign should provide a new way of examining trends in international graduate student application, admission, and enrollment trends, and in anticipation of this new report, this article examines trends in degree production among temporary residents using data from the U.S. Department of Education’s National Center for Education Statistics Integrated Postsecondary Education Data System (IPEDS).
Data Sources: Revisiting Applications Data
March 2015
Since the launch of the CGS/GRE Survey of Graduate Enrollment & Degrees, the number of applications to U.S. graduate programs has grown almost three-fold, from 684,100 in Fall 1986 to 1,971,553 in Fall 2013 (Syverson & Robinson, 1987; Allum, 2014). Although much of the growth in applications has occurred within the past decade, the rate of growth appears to be slowing (Allum, 2014). Examining application patterns in depth may be useful as graduate enrollment management strategies continue to evolve with changes in the higher education ecosystem. The CGS/GRE Survey of Graduate Enrollment & Degrees is ideal for this purpose, due to the fact that it is the only national survey that collects data on applications to graduate schools by field of study and degreeobjective. This Data Sources article explores changes in applications received, accepted, and not accepted between 2009 and 2013.
Data Sources: Highlights from the Fall 2014 CGS Pressing Issues Survey
January/February 2015
In October of 2014, CGS asked graduate deans at member institutions to identify the three most important or “pressing” issues or challenges they currently face in the Fall 2014 version of the CGS Pressing Issues Survey. The findings from this survey will not only inform the graduate community about the concerns of graduate deans, but also help shape sessions at the CGS Summer Workshop and Annual Meeting. These insights will also provide impetus for new CGS best practices projects and research initiatives. The Fall 2014 version of the CGS Pressing Issues Survey was sent to 518 U.S. colleges and universities that were members of CGS as of September 2014. A total of 166 institutions responded to the survey, for a response rate of 32%. Recruitment, admissions, and enrollment tops the list as the most pressing issue for graduate deans as of the fall of 2014, followed closely by student financial support. Graduate program financing and capacity building were ranked third and fourth. Of particular concern are growing demands to generate revenue during times of flat or falling enrollment.
Whither Knowledge: Notes on the Credibility of Evidence for Policy
March 6, 2017
Based on his recent book, The Rising Price of Objectivity: Philanthropy, Government, and the Future of Education Research, Dr. Michael J. Feuer, dean and professor of the George Washington University Graduate School of Education and Human Development and the president of the National Academy of Education offered insights into the state of education research, evidence-based public policy, and the role of philanthropy.
Rethinking Graduate Education for the 21st Century
June 5, 2017
Based on past meetings of the National Academies of Sciences, Engineering, and Medicine committee on Rethinking Graduate Education for the 21st Century, Leshner and Sherer talked about the Academies’ on-going work on Revitalizing Graduate STEM Education for the 21st Century. Following their remarks, the audience offered feedback and insights pertinent to their work.
Highlights from the 2016 CGS/GRE Survey of Graduate Enrollment & Degrees
September 20, 2017
A preview of the 2016 Graduate Enrollment & Degree survey results, which was released to the public on September 28, 201, was presented, including the latest trends in applications for admission to graduate school, first-time and total graduate student enrollment, and graduate degrees and certificates conferred.
Snapshot Report – From Community College to Graduate and Professional Degrees
December 19, 2017
Jason DeWitt, Research Manager, National Student Clearinghouse Research Center, discussed a recently released snapshot report from the National Student Clearinghouse Research Center. The report is the first Community College to Graduate and Professional Degrees and demonstrates that community colleges serve as a starting point for nearly 20 percent of 2016-17 master’s degree earners, 11 percent of 2016-17 doctoral-research degree earners, and 13 percent of 2016-17 professional degree earners.
FOR IMMEDIATE RELEASE
Contact: Julia Kent | (202) 461-3874 / jkent@cgs.nche.edu
Declining Applications from Key Countries Contribute to Slowed Growth in Prospective Student Interest
Washington, DC —New data from the Council of Graduate Schools (CGS) reveal that first-time international graduate enrollment increased by 5% in Fall 2016, the same rate of growth seen last year. Yet U.S. institutions saw a lag in growth in the total number of international graduate applications, from 3% in 2015 to 1% in 2016.
The slow-down in application growth occurred despite a 4% increase in the number of applications from prospective Chinese graduate students, who constitute the largest subgroup of international students both in terms of applications and enrollments. The overall decrease in application growth was due to the combined effect of decreases in applications from important sending countries and regions: India (-1%), the Middle East and North Africa (-5%), South Korea (-5%), and Brazil (-11%).
While application counts of prospective European graduate students to U.S. institutions remained consistent with last year, first-time enrollment of European graduate students at U.S. institutions rose by 8%, ending the recent streak of declining enrollment growth rates from this region.
“The continued increase in enrollments is good news for U.S. universities,” said CGS President Suzanne Ortega, “but we can’t take that position for granted. Universities in the U.S. and around the world are waiting to see the potential impact of the uncertain policy environment on the mobility patterns of international graduate students.” Dr. Ortega added that the recent executive order that bars entry or return of U.S. visa holders from specific countries poses a concern. “We must ensure that the U.S. remains an attractive and viable place for the world’s most talented students to pursue education and research.”
The report also includes data on trends by field of study. In terms of total applications and first-time enrollments, Business (17% and 20% respectively), Engineering (30% and 26% respectively), and Mathematics and Computer Sciences (21% and 20% respectively) continue to be the most popular fields of study. Sixty-eight percent of total international graduate applications and 78% of first-time graduate enrollments were to master’s and certificate programs, suggesting that U.S. master’s programs continue to be viewed as good investments by international students.
As the only report of its kind to offer data on the current academic year, International Graduate Applications and Enrollment: Fall 2016 reports applications, admissions, and enrollments of international master’s, certificate, and doctoral students at U.S. colleges and universities. Additional report findings can be found in the attached page of highlights.
About the survey and report
Conducted since 2004, the CGS International Graduate Admissions Survey tracks the applications and enrollments of international students seeking U.S. master’s and doctoral degrees. In Fall 2016 the survey was redesigned to collect data by degree objective (master’s and graduate certificate vs. doctorate), and for all seven regions of origin, eight countries of origin, and all eleven broad fields of study, yielding the only degree-level data currently available for graduate admissions and enrollments. 395 U.S. graduate institutions who are members of CGS or its regional affiliates responded to the 2016 survey.
The Council of Graduate Schools (CGS) is an organization of approximately 500 institutions of higher education in the United States and Canada engaged in graduate education, research, and the preparation of candidates for advanced degrees. The organization’s mission is to improve and advance graduate education, which it accomplishes through advocacy in the federal policy arena, research, and the development and dissemination of best practices.
By Linda DeAngelo
Some of the counselors there [at CSU attended] have real preconceived notions of what minority students are capable of achieving, and they steer minority students away from graduate school. They even went as far as to steer me away from being a math and science teacher. When I started at [CSU attended] they [counselors] wanted to place me in basic [remedial] courses and were really surprised by my test score.” Latina doctoral student studying biology. --From DeAngelo, 2009
He [a Latino student who had just as much potential as I do] did not have the information he needed to even really know what graduate school is all about or what it would take for him financially.
White doctoral student studying genetics. --From DeAngelo, 2009
Introduction
One of the most important influences to a student’s pursuit of graduate education—if not the most important—is having a faculty mentor during a student’s undergraduate education. This is especially relevant for students of color who remain underrepresented in graduate education (Kim, 2011; U.S. Department of Education, 2014). While there are a number of potential reasons for the underrepresentation of students of color in graduate education, one explanation that has gained traction, and is problematized in this brief, situates the problem as one of academic mismatch. Academic mismatch occurs when students are overmatched academically at the institutions they attend as undergraduates. Mismatch is thought to create a situation that causes overmatched students of color to perform poorly academically, which in turn limits their aspirations for and potential to succeed in graduate education. This narrative was recently argued in the Wall Street Journal opinion pages by law professor Gail Heriot of the University of San Diego, who discusses the reason why we do not have more black scientists. Heriot (2015) stated, “Encouraging black students to attend schools where their entering credentials places them at the bottom of the class has resulted in fewer black physicians, engineers, scientists, lawyers, and professors than would otherwise be the case.[1]” While academic achievement is relevant to graduate study, the research presented in this brief reveals that the real crisis is not academic mismatch but a scarcity of the mentoring relationships that lead to graduate education.
The brief begins with a review of mentoring – what constitutes mentoring, motivations for mentoring, which students get mentored, and the importance of mentoring to graduate education. A discussion of the scarcity of mentoring for students of color, especially at more selective institutions, and how this challenges the mismatch hypothesis follows. The brief concludes with ways that institutions can recognize barriers to faculty mentorship and support faculty in engaging in these relationships.
What Constitutes Mentoring and Motivations for Mentoring
Mentoring is described in a number of ways and can be constituted differently based on the relationship present. However, the most powerful mentoring relationships tend to encompass four characteristics. These characteristics include (a) a focus on achievement and development of potential, (b) a reciprocal and personal relationship, (c) a relationship where the mentor is an individual with more experience, influence, and achievement, and (d) a relationship where the mentor takes on emotional and psychological support and directly assists with career aspirations and planning through role modeling (Crisp & Cruz, 2009; Jacobi, 1991). These four characteristics move interaction between students and faculty to the level of mentoring.
Although expected roles for faculty include advising and teaching, which naturally includes interaction with students, the mentoring relationships that are most successful in supporting students to pursue graduate studies fall outside of this formal faculty role. For example, as DeAngelo and colleagues (2016) describe, expected role behavior with undergraduate students includes behavior that is aligned with institutional or departmental expectations of faculty role, such as advising regarding course selection and matriculation, the involvement of students in research experiences, and teaching of hard skills required for admission and success in graduate education. However, extra-role behavior that constitutes mentoring is behavior that is not explicitly required, recognized, or rewarded as part of faculty role (DeAngelo et al., 2016; Johnson & Ridley, 2004). This includes actively identifying and approaching students to initiate mentoring relationships, promoting graduate education as an option for students, and actively working to socialize students to the academic culture. In addition, this behavior takes place both within and outside formal channels, and the behavior within formal channels goes above and beyond the formally sanctioned role of the faculty.
Motivations to engage in this type of behavior vary, but for those within the DeAngelo and colleagues’ (2016) study, there were two primary reasons for engaging in these relationships. Some faculty pursued mentoring relationships with undergraduate students because of their personal experiences and a sense of responsibility related to assisting students to enter graduate study. For example, faculty discussed positive mentoring experiences that they wanted to emulate or a lack of mentorship they received that intensified their desire to mentor undergraduate students. Other faculty saw a benefit in supporting students with whom they could personally identify (students of color and/or first-generation students).
Who Gets Mentored and the Importance of Mentoring
Students who perform at high levels, and who demonstrate motivation and proactive behaviors, “rising stars” (Ragins & Cotton, 1999; Singh et al., 2009), fit the dominant paradigm for student success (Bensimon, 2007), and are more likely to be mentored (Fuentes, et al., 2014; Robertson, 2010). In this dominant paradigm for student success, “the student is an autonomous and self-motivated actor who exerts effort in behaviors that exemplify commitment, engagement, regulation, and goal-orientation” (Bensimon, 2007, p. 447). Therefore, “rising stars” tend to be more engaged in their academic endeavors and interact informally with faculty during their early college careers. Fuentes and colleagues (2014) demonstrate that this early interaction with faculty results in more frequent mentoring relationships later in college. The lack of investment in mentoring students that faculty initially identify as “lesser quality” works against diversification of graduate education.
While mentoring relationships can be initiated by either party and can take shape in a number of ways, the most meaningful mentoring relationships emerge when there is a commitment by both the student and faculty member. These active and committed relationships help students become oriented to their institutions and their academic fields (Becher, 1989; Eagan et al., 2011; Weidman, 2006) and provide valuable networking resources and access to information (Stanton-Salazar, 1997, 2010). Especially important to increasing diversity in graduate studies, strong mentoring relationships guide students along their educational pathways, helping them to gain additional confidence to pursue advanced studies (Crisp & Cruz, 2009; DeAngelo, 2009, 2010; Eagan et al., 2011; Landefeld, 2009; Seymour et al., 2004).
Research demonstrates that students of color have degree aspirations that equal or exceed their white counterparts, yet they are no more likely than white students to pursue graduate study (Cherwitz, 2013; English & Umbach, 2016). Students of color are also less likely to be mentored than white students (Felder, 2010; Johnson, 2015; Milkman et al., 2014, Thomas et al., 2007). Even though students of color are less likely to be mentored, studies continue to document the importance of these relationships for pursuing graduate education. Faculty mentors can serve as role models within the discipline and provide cultural and social capital for diverse students, especially in fields where women and minorities are particularly underrepresented (Whittaker & Montgomery, 2014). While beneficial to all students, intensive mentoring relationships may be particularly important for students of color in pursuing graduation study (Davis, 2008; Davidson & Foster-Johnson, 2001; DeAngelo, 2009, 2010; Felder, 2010).
Examining the Mentoring Crisis for Student of Color at Selective Institutions
In examining faculty mentorship for students of color, the study of DeAngelo (2008) is particularly relevant and will be explored in some detail here. This study examined the role of the college experience in the development and maintenance of PhD degree aspirations[2]. To understand the role of institutional selectivity as it relates to the opportunity for mentorship, it is important to first examine relationships as the relate distribution of students by selectivity. From the DeAngelo (2008) study, Table 1 displays the distribution of underrepresented racial minority[3] and white students by institutional selectivity in the study and Table 2 displays these relationships restricted to just those students who aspire to the PhD at the end of college.
Table 1:
|
Distribution of Students by Institutional Selectivity in Full Sample from DeAngelo (2008) Study |
|||
|
|
Low Selectivity |
Medium Selectivity |
High Selectivity |
|
White |
32% |
36% |
32% |
|
Underrepresented Racial Minority |
40% |
28% |
32% |
Table 1 shows that an equal percentage of underrepresented racial minority students and white students attend high selectivity institutions (32%), but a disproportionate percentage of underrepresented racial students attend low selectivity institutions (40% in comparison to 32% of white students). These relationships as they relate selectivity change dramatically when the sample of undergraduate students is restricted to those who aspire to the PhD at the end of college. Table 2 shows that among white students at low selectivity institutions a smaller percentage (25%) than in the overall sample (32% Table 1) aspire to the PhD at the end of college, whereas at high selectivity institutions the percentage of white students (41%) is higher than in the overall sample (32% Table 1). For white students, as selectivity increases so does the percentage who aspire to the PhD at the end of college. A much different relationship is present for underrepresented racial minority students. At low selectivity institutions the percentage of underrepresented racial minority students who aspire to the PhD at the end of college is roughly the same (39%) as in the overall sample (40% Table 1). Further, at high selectivity institutions while the percentage of underrepresented racial minority students who aspire to the PhD at the end of college is higher (36%) than the percentage in the overall sample (32% Table 1) the percentage point increase is not nearly as large as it is for white students (4 vs 9 percentage points). The question then becomes what contributes to these relationships? The weight of the evidence in the results from the DeAngelo (2008) study demonstrates that access to mentoring rather than academic mismatch underlies these differences[4].
Table 2:
|
Distribution of Students by Institutional Selectivity Restricted to Students Who Aspire to the PhD at the End of College from DeAngelo (2008) Study |
|||
|
|
Low Selectivity |
Medium Selectivity |
High Selectivity |
|
White |
25% |
34% |
41% |
|
Underrepresented Racial Minority |
39% |
25% |
36% |
In looking at the results from the DeAngelo (2008) study, the single largest effect on PhD aspirations was the level of faculty encouragement for graduate study. The higher the amount of encouragement for graduate study from faculty, the more likely both underrepresented racial minority students and white students were to aspire to the PhD (all other factors equal and controlled). Although both white students and underrepresented racial minority students benefited from encouragement for graduate study, a factor that is part of a strong mentoring relationship for students of color (DeAngelo, 2009; 2010), the relative size of the benefit was much larger for underrepresented racial minority students. Odds ratios from the study indicate that occasional encouragement for graduate study (vs. no encouragement) increases the odds of a white student aspiring to the PhD at the end of college by 42%, whereas the increase in odds is 238% for underrepresented racial minority students. At the frequent encouragement level (vs. no encouragement) the trend continues with white students having a 170% larger odds of aspiring to the PhD and underrepresented racial minority students having a 332% increased likelihood of PhD aspirations.
Returning to the role of institutional selectivity in access to faculty mentoring, the DeAngelo (2008) study tested for an interaction effect between selectivity and faculty encouragement. For white students, this interaction was significant (see Figure 1). In this figure, the level of encouragement a white student receives is on the X axis and the log likelihood increase in PhD aspirations is on the Y axis. The dotted and solid lines graph the increases in PhD aspirations by institutional selectivity (low, medium, high) and encouragement level. As the figure demonstrates, white students who are encouraged frequently are more likely to aspire to the PhD at the end of college if they are at a high selectivity institution, and less likely if they are at a low selectivity institution (all other factors equal, and controlled). Further, additional testing demonstrated that the difference in odds is significantly different at low and high selectivity institutions, an increase in odds of 52% for frequent encouragement and high vs. low selectivity, and a decrease in odds of 13% for no encouragement and high vs. low selectivity. Thus, white students who attend high selectivity institutions who are not encouraged for graduate study are significantly less likely to aspire to the PhD at the end of college than are equally similar white students who attend low selectivity institutions. This finding suggests that in the absence of faculty encouragement at high selectivity institutions white students have difficulty envisioning themselves as a future member of professoriate.
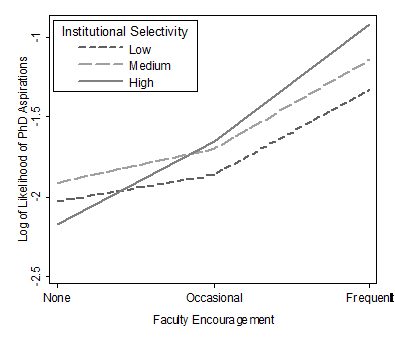
Figure 1: Interaction between Selectivity and Faculty Encouragement for Graduate Study for White Students from the DeAngelo (2008) Study
The DeAngelo (2008) study ran the same interaction for underrepresented racial minority students and the effect was not significant. Specifically, results in the study demonstrated that differences in the significance of this interaction for white and underrepresented racial minority students were likely related to the chances of being encouraged for graduate study by institutional selectivity. Keeping in mind faculty encouragement is a strong factor in PhD aspirations in this study, and that faculty mentoring is particularly important to graduate study for student of color (Davis, 2008; Davidson & Foster-Johnson, 2001; DeAngelo, 2009, 2010; Felder, 2010), data from this study indicated that white students were just as likely to be frequently encouraged for graduate study at high (35%) and low selectivity institutions (36%), whereas underrepresented students were more likely frequently encouraged at low (55%) vs. high selectivity institutions (40%). Thus, the weight of evidence in DeAngelo (2008) study suggests that it is the opportunity for encouragement at high and low selectivity institutions[5] for underrepresented racial minority students, rather than academic mismatch which is depressing aspirations for the PhD at high selectivity institutions and contributing to the lack of diversity present in graduate study, the pipeline to the professoriate and learned professions.
Barriers and Supports to Mentoring
In order to increase the opportunity for students of color to be mentored, institutional leaders and those concerned about diversity in graduate education must support mentoring. The DeAngelo and colleagues (2016) study identified that barriers and supports to mentoring typically fit within three areas: the culture of the institution, the culture of the academic discipline, or the culture of the academic profession. The culture of the institution either promotes or deters mentoring in a number of ways. For example, the institutional expectations related to teaching and advising can hinder the development of mentoring relationships, the educational mission can impede engagement in mentoring toward graduate study, and institutional support for graduate study can be relegated to a few programs that do not serve many students. Conversely, institutional culture can support the development of mentoring by creating settings where a group of faculty can be jointly committed to promoting mentoring and graduate study. These settings created cultural supports for mentoring despite an overall cultural ethos at the institution that was a deterrent. Ultimately, without a supportive institutional culture, DeAngelo and colleagues (2016) concluded that faculty members who wish to engage in mentoring must, in general, work against that overall institutional culture.
Secondly, DeAngelo and colleagues (2016) found that academic discipline can promote or deter mentoring behaviors. Sixty-one percent of STEM faculty compared to 18% of Humanities and Social Science faculty in the study discussed research experiences as a way to engage with students. This platform is naturally available to STEM disciplines where research labs provide a structure to facilitate interaction and opportunities for mentoring relationship to develop. Conversely, humanities and social science disciplines must work to use the classroom to engage students, where mentoring behavior may take additional effort to manifest.
Finally, the culture of the academic profession creates a host of barriers and few, if any, supports to mentoring behaviors. The culture of the academic profession regulates the availability of opportunities for extra-role behavior through a system of promotion and tenure that drives the importance and need for research productivity and lacks rewards for mentoring undergraduates or a recognition of the time it takes to engaging in mentoring students. Lastly, in the DeAngelo and colleagues study (2016), the faculty workload related to teaching can lead faculty to overly focus on teaching as interaction, which can become a substitute for mentoring.
Shifting Culture to Support Mentoring
Given the importance of mentoring to access to graduate study, especially for underrepresented racial minority students, it is imperative that institutional leaders support the extra-role behaviors associated with developing these positive relationships. Specifically, we need to address the bias, racialized and otherwise, engrained in institutional cultures that have resulted in this crisis of mentoring of students of color at selective institutions. Shifting these cultures requires institutional leaders and other institutional actors to interrupt the oppressive structures that allow the bias inherent in these cultures to silently propagate limiting beliefs regarding the academic capacity students of color who attend these institutions[6].
Moreover, individual actors and institutional leaders need to actively and demonstrably value faculty engagement in mentorship. Incorporating mentorship as a critical component of quality undergraduate education (DeAngelo et al., 2016) remains a vital first step in building cultures that supports mentoring. Overt communication from institutional leaders that emphasizes the necessity of faculty mentorship for undergraduate students in the creation of the next generation of faculty and a diverse professoriate serves as another foundational component of structurally supporting mentorship. Recognizing the time intensive nature and workload associated with mentoring and incorporating it into how faculty are rewarded externally validates this behavior and contributes to shifting culture. Only when we have the cultural shifts that produce equity as it relates who is mentored toward graduate education can we realize the potential to develop a diverse pipeline into the professoriate and learned professions.
Note: This brief is based on a presentation given at the Spring 2016 CGS Research & Policy Forum. Any opinions, findings, and conclusions or recommendations expressed in this paper are those of the author and do not necessarily reflect the views of the Council of Graduate Schools.
Suggested Citation: DeAngelo, L. (2016). Supporting Students of Color on the Pathway to Graduate Education (CGS Data Sources PLUS 16-02). Washington, DC: Council of Graduate Schools.
About the Author: Linda DeAngelo is assistant professor of higher education and Center for Urban Education Faculty Fellow at the University of Pittsburgh. Email: deangelo@pitt.edu.
References
Arcidiacono, P., & Lovenheim, M. (2016). Affirmative action and the quality-fit tradeoff. Journal of Economic Literature. 54 (1): 30, 31 and 69. doi:10.1257/jel.54.1.3.
Becher, T. (1989). Historians on history. Studies in Higher Education, 14(3), 263-278.
Bensimon, E. M. (2007). The underestimated significance of practitioner knowledge in the scholarship on student success. The Review of Higher Education, 30(4), 441-469.
Cherwitz, R. A. (2013). The challenge of diversifying higher education in the post-fisher era: No profound increase in diversity will occur until significant and progress is made in convincing talented minorities to pursue graduate study. Planning for Higher Education, 41(1), 113-116.
Cole, S., & Barber, E. (2003). Increasing faculty diversity. Cambridge, MA: Harvard University Press.
Crisp, G., & Cruz, I. (2009). Mentoring college students: A critical review of the literature between 1990 and 2007. Research in Higher Education, 50, 525–545. doi:10.1007/s11162-009-9130-2.
Davidson, M., & Foster-Johnson, L. (2001). Mentoring in the preparation of graduate researchers of color. Review of Educational Research, 71(4), 549–574.
Davis, D. J. (2008). Mentorship and the socialization of underrepresented minorities into the professoriate: examining varied influences. Mentoring & Tutoring: Partnership in Learning, 16(3), 278–293.
Davis, J. A. (1966). The campus as a frog-pond: an application of the theory of relative deprivation to career decisions of college men. American Journal of Sociology, 72(1), 17-31.
DeAngelo, L. (2008). Increasing faculty diversity: How institutions matter to the PhD aspirations of undergraduate students (Doctoral dissertation). Retrieved from ProQuest Dissertations and Theses. (Accession Order No. AAT 3302576).
DeAngelo, L. (2009). Can I go?: An exploration of the influence of attending a less selective institution on students’ aspirations and preparation for the Ph.D. In M. F. Howard-Hamilton, C. L. Morelon-Quainoo, S. D. Johnson, R. Winkle-Wagner, & L. Santiague (Eds.), Standing on the outside looking in: Underrepresented students’ experiences in advanced degree programs (pp. 25-44). Sterling, VA: Stylus.
DeAngelo, L. (2010). Preparing for the PhD at a comprehensive institution: Perceptions of the “barriers.” Journal of the Professoriate, 3(2), 17-49.
DeAngelo, L., Mason, J., & Winters, D. (2016). Faculty engagement in mentoring undergraduate students: How institutional environments regulate and promote extra-role behavior. Innovative Higher Education, 41:317–332. doi: 10.1007/s10755-015-9350-7.
Eagan, K., Herrera, F. A., Garibay, J. C., Hurtado, S., & Chang, M. (2011, May). Becoming STEM proteges: Factors predicting the access and development of meaningful faculty-student relationships. Paper presented at the Association for Institutional Research Annual Forum, Toronto.
English, D., & Umbach, P. D. (2016). Graduate school choice: An examination of individual and institutional effects. Review of Higher Education, 39(2), 173-211.
Felder, P. (2010). On doctoral student development: Exploring faculty mentoring in the shaping of African American doctoral student success. Qualitative Report, 15(2), 455–474.
Fuentes, M., Berdan, J., Ruiz, A., & DeAngelo, L. (2014). Mentorship matters: Does early faculty contact lead to quality faculty interaction? Research in Higher Education, 55, 288-307. doi: 10.1007/s11162-013-9307-6.
Heriot, G. (2015, October 21). Why aren’t there more black scientists? The Wall Street Journal. Retrieved from www.wsj.com.
Jacobi, M. (1991). Mentoring and undergraduate academic success: A literature review. Review of Educational Research, 61(4), 505–532.
Johnson, W., & Ridley, C. (2004). The elements of mentoring. New York, NY: Palgrave Macmillan.
Johnson, W. B. (2015). On being a mentor: A guide for higher education faculty. 2nd ed. New York, NY: Routledge.
Kim, Y. M. (2011). Minorities in higher education: Twenty-fourth status report, 2011 Supplement. Washington, D.C.: American Council on Education.
Landefeld, T. (2009). Mentoring and diversity: Tips for students and professionals for developing and maintaining a diverse scientific community. New York, NY: Springer.
Milkman, K. L., Akinola, M., Chugh, D. (2014). What happens before? A field experiment exploring how pay and representation differentially shape bias on the pathway into organizations. Journal of Applied Psychology, 100(6), 1678-1712. doi:10.1037/ap10000022
McCoy, D. L., Winkle-Wagner, R., & Luedke, C. L. (2015). Colorblind mentoring? Exploring white faculty mentoring of students of color. Journal of Diversity in Higher Education, 8(4), 225–242. doi:10.1037/a0038676
Ragins, B. R., & Cotton, J. L. (1999). Mentor functions and outcomes: A comparison of men and women in formal and informal mentoring relationships. Journal of Applied Psychology, 84, 529–550.
Robertson, T. M. A. (2010). Making the connection: How faculty choose proteges in academic mentoring relationships (Doctoral dissertation). Retrieved from ProQuest Dissertation and Theses (Accession No. 3417777).
Sander, R. H. (2004). A systemic analysis of affirmative action in American law schools. Stanford Law Review, 57(2), 367-483.
Seymour, E., Hunter, A., Laursen, S. L., & DeAntoni, T. (2004). Establishing the benefits of research experiences for undergraduates in the sciences: First findings from a three-year study. Science Education, 88, 493–534.
Singh, R., Ragins, B. R., & Tharenou, P. (2009). Who gets a mentor? A longitudinal assessment of the rising star hypothesis. Journal of Vocational Behavior, 74(1), 11–17.
Stanton-Salazar, R. D. (1997). A social capital framework for understanding the socialization of racial minority children and youths. Harvard Educational Review, 67(1), 1-41.
Stanton-Salazar, R. D. (2010). A social capital framework for the study of institutional agents and their role in the empowerment of low-status students and youth. Youth & Society. Advance online publication. doi: 10.1177/0044118X10382877.
Thomas, K. M., Willis, L. A., & Davis, J. (2007). Mentoring minority graduate students: Issues and strategies for institutions, faculty, and students. Equal Opportunities Interactions, 26(3), 178-192. DOI 10.1108/02610150710735471
U.S. Department of Education (2014). Postsecondary completers and completions: 2011-12. Washington D.C.: National Center for Education Statistics.
Weidman, J. (2006). Student socialization in higher education: Organizational perspectives. In C. Conrad & R. C. Serlin (Eds.), The SAGE handbook for research in education: Engaging ideas and enriching inquiry (pp. 253-262). Thousand Oaks, CA: SAGE.
Whittaker, J. A., & Montgomery, B. L. (2013). Cultivating institutional transformation and sustainable stem diversity in higher education through integrative faculty development. Innovative Higher Education, 39(4), 263–275.
[1] See Cole & Barber (2003), Saunder (2004), and Arcidiacono & Lovenheim, (2016) for scholarly examinations of the mismatch hypothesis, and Davis (1966) for the social theory of mismatch, also termed the frog-pond hypothesis. Arguments related to mismatch suggest that if students of color attended institutions where there entering credentials were better matched, their academic performance would be stronger and more would then aspire to and successfully enter graduate education, the pipeline to the professoriate and learned professions.
[2] The DeAngelo (2008) study used hierarchical generalized linear modeling to study PhD aspirations development at the end of the college experience for underrepresented racial minority and white students. The study included 13,645 students at 251 institutions across the country.
[3] In the DeAngelo (2008) study the term underrepresented racial minority students was used to refer to Black/African American, Hispanic/Latinx, and American Indian students which were the focus of the study. In this brief this term is used specifically when the results of the DeAngelo (2008) study are discussed; whereas the term students of color is used throughout the rest of the brief.
[4] A direct test of the mismatch hypothesis (Davis, 1966) was conducted in the DeAngelo (2008) study. Results indicated that there was no evidence of mismatch for underrepresented racial minority students as it contributed to PhD aspirations.
[5] In the DeAngelo (2008) study at the institutional level selectivity was a significant predictor of PhD aspirations for both underrepresented racial minority and white students.
[6] See McCoy, Winkle-Wagner, Luedke (2015) for an empirical exploration of this issue.
Overall First-Time Graduate Enrollment Increases by 3.9%
Contact:
Julia Kent, CGS: (202) 461-3874 / jkent@cgs.nche.edu
Washington, DC — The Council of Graduate Schools (CGS) today reported modest growth in first-time enrollments for a number of key demographic groups enrolling in graduate school. Notably, all underrepresented minority (URM) groups monitored by the survey saw greater increases in first-time graduate enrollment than their White, non-Hispanic counterparts, although their overall representation in the graduate student body still remains relatively low. Among first-time U.S. citizens and permanent resident graduate students in Fall 2015, at least 22.5% were underrepresented minorities, including American Indian/Alaska Native (0.5%), Black/African American (11.8%), Native Hawaiian/Other Pacific Islander (0.2%), and Hispanic/Latino (10%).
CGS President Suzanne T. Ortega responded to the growth in URM graduate enrollment with cautious optimism. “The sizeable increase in overall first-time enrollments for underrepresented minorities, particularly seen among URM women, is great news, but the share of underrepresented minorities among U.S. citizens and permanent residents is similar to previous years. URMs remain proportionally underrepresented, and we must sustain this trend for several years to ensure a larger impact across graduate programs and a more diverse workforce.”
Survey results also showed increases in domestic and international enrollments. Between Fall 2014 and Fall 2015, there was an increase (3.8%) in first-time enrollments for U.S. citizens and permanent residents, the largest one-year increase since 2010. These gains contributed to a 3.9% one-year increase in all first-time graduate enrollment between Fall 2014 and Fall 2015—the largest since 2009.
First-time graduate enrollment of international students rose by 5.7%, a rate considerably lower than in recent years, though international students still constitute a robust share (22%) of first-time graduate students. At research universities with very high research activity (RU/VH), three out of ten first-time enrollees (30.4%) were temporary residents. Shares of international students among first-time enrollees were particularly high for fields of mathematics and computer sciences (63.2%) followed closely by engineering (58.5%).
Institutions responding to the CGS/GRE Survey of Graduate Enrollment & Degrees for Fall 2015 again set new highs for the admissions cycle, receiving more than 2.18 million applications, extending over 877,000 offers of admission in Fall 2015, and enrolling nearly 507,000 incoming, first-time graduate students in graduate certificate, education specialist, master’s, or doctoral programs.
Other report findings are summarized below.
Findings by field
Findings by degree level
Student demographics
About the report
Graduate Enrollment and Degrees: 2005 to 2015 presents the findings of an annual survey of U.S. graduate schools, co-sponsored by CGS and the Graduate Record Examinations (GRE) Board. It is the only annual national survey that collects data on graduate enrollment by all fields of study and is the only source of national data on graduate applications by broad field of study. The report, which includes responses from 617 institutions, presents statistics on graduate applications and enrollment for Fall 2015, degrees conferred in 2014-15, and trend data for one-, five- and ten-year periods.
The Council of Graduate Schools (CGS) is an organization of approximately 500 institutions of higher education in the United States and Canada engaged in graduate education, research, and the preparation of candidates for advanced degrees. The organization’s mission is to improve and advance graduate education, which it accomplishes through advocacy in the federal policy arena, research, and the development and dissemination of best practices.
Contact: Katherine Hazelrigg
202.461.3888 / khazelrigg@cgs.nche.edu
Washington, D.C. – Since 2004 the Council of Graduate Schools (CGS) has conducted the International Graduate Admissions Survey, an annual study of applications and offers of admission, as well as first-time and total enrollment of international graduate students in master’s/certificate and research doctoral programs. The data from the 2016 preliminary applications survey provide an initial look into Fall 2016 international graduate admissions at U.S. institutions, and suggest that it will follow recent trends.
Key points gleaned from our preliminary dataset are below. Visit the CGS website for additional information including infographics, data tables, and notes and definitions from the survey. The final application counts, along with first-time and total international graduate enrollment for Fall 2016 will be available in early 2017.
Key points from the 2016 CGS International Graduate Admissions Survey: Preliminary Applications
As researchers, entrepreneurs, inventors, and more, graduate students and graduate degree holders contribute to the resolution of complex social problems and advancement of our society. Thus, a robust growth of graduate education and the number of advanced degree holders in our nation’s labor force is essential to economic prosperity and continued global leadership of the United States. The most recent Survey of Earned Doctorates (SED:14), an annual census of research doctorate recipients conducted by the National Science Foundation (NSF), reported that a total of 54,070 individuals earned a research doctorate at 426 US academic institutions between July 1, 2013 and June 30, 2014. This represents both the highest number in the survey’s history since 1957 and positive growth of earned doctorates for the fourth year in a row. Detailed characteristics of the doctoral recipients can be found in the recently released NSF report on SED:14, “Doctorate Recipients from US Universities: 2014,”and this article summarizes some key takeaways for graduate deans.
Citizenship
International graduate students continue to increase in their share of US earned doctorates. Nearly three out of ten (29%) doctoral recipients were temporary visa holders in 2014, compared to 22% a decade ago. Their presence is particularly robust in science and engineering (S&E) fields, as 40% of S&E doctorates were conferred to international students in 2014. However, their countries of origin are not as diverse; only three countries—China, India, and South Korea—accounted for more than one- half of all doctorates earned by international students in 2014. Moreover, the top ten sending countries constituted 70% of the doctorates earned (See Table 1).
%20-%20Table%201_kh2.jpg)
The robust representation and continued growth of international graduate students does not come as a surprise, and will likely continue as pointed out in recent CGS reports on enrollment trends of international graduate students. Most of the recent growth in first-time graduate enrollment was driven by international students, with a particularly high concentration of them enrolled in S&E fields (Allum & Okahana, 2015). China and India continue to hold the largest shares of international graduate enrollment in the United States, and the largest share of South Korean students (47%) pursued doctorates (Okahana & Allum, 2015). While these statistics demonstrate the consistent appeal and desirability of US doctoral programs (Okahana & Allum, 2015), heavy reliance on a few selected countries of origin may pose vulnerability for long-term and sustainable enrollment planning for graduate institutions. Given the volatility of changes in first-time graduate enrollment seen in the results from the past CGS International Graduate Admissions Surveys, international recruitment strategies should look to diverse sets of countries.
Race/Ethnicity
International graduate students were not the only ones who increased their shares of US earned doctorates. Traditionally underrepresented minority (URM) students made gains in their attainment of research doctorates. Between 1994 and 2014, the proportion of doctorates awarded to Blacks/African Americans rose from 4.1% to 6.4%, while the proportion for Hispanics/Latinos nearly doubled, from 3.3% to 6.5% during the same time period (See Table 2). We anticipate this growth trend to continue, as first-time graduate enrollment of both Hispanic/Latino and Black/African American students are on the rise. According to the most recent CGS/GRE Survey of Graduate Enrollment and Degrees (GE&D), first-time graduate enrollment of Hispanic/Latino students and Black/African American students grew on average 6.0% and 5.2%, respectively, each year between 2004 and 2014 (Allum & Okahana, 2015).
%20-%20Table%202_kh.jpg)
However, not all URM populations gain their ground. According to the SED:14, there was no growth in the number of earned doctorates between Fall 2004 and Fall 2014 among American Indian/Alaska Native students (See Table 2). They were also the only ethnic and racial group that did not experience a decline in the number of doctorate holders who were also first- generation students between 1994 and 2014. This is consistent with the enrollment trend in the most recent GE&D report, which showed first-time graduate enrollment of American Indian/Alaska Native students declined by -0.6% annually between Fall 2004 and Fall 2014 (Allum & Okahana, 2015). The challenges that impact the enrollment and completion of doctoral education by American Indian/Alaska Native students are worth further exploration.
Gender and Field of Study
Over the past 20 years, the growth in the number of women awarded S&E doctorates has exceeded the growth in males earning S&E doctorates, as reported in the 2014 SED. Between 1994 and 2014, the number of men awarded S&E doctorates increased by 26% (nearly 5,000 more doctorates) while the number for female S&E doctorates increased by nearly 50% (at least 8,500 more doctorates). The fastest growing subfields of doctoral study for women over the past decade, according to the SED:14, were the physical sciences field with computer and information sciences as lead subfield, and engineering with materials science engineering as lead subfield. Though the gap between men and women in these two fields is still substantial (See Figure 1), this is an encouraging sign. The enrollment trends of women in these two fields also shed some positive light, as the average annual percent changes between 2009 and 2014, for first- time enrollment of women in engineering (2.6%) and mathematics and computer sciences (3.5%) surpassed that of men (1.7% and 1.8%, respectively) (Allum & Okahana, 2015).
%20-%20Figure%201_khv2.jpg)
Summary
The average annual growth in the number of doctorates awarded between 1957 and 2014 was 3.4%, a strong upward trend in spite of periods of slow growth and decline. The increase in earned research doctorates by individuals with traditionally underrepresented backgrounds is impressive and an encouraging and critical step in our pursuit of a more diverse, educated, and skilled workforce that is better prepared for a competitive global economy. However, there is still work to be done as attainment gaps between men and women, URMs and non- URMs, and within URM students persist. In the meantime, the NSF report, “Doctorate Recipients from US Universities: 2014,” offers other interesting insights about the most recent cohort of doctoral recipients, and we encourage you to explore the data.
By Hironao Okahana, Director, Statistical Analysis & Policy Research and Keonna Feaster, Program Manager, Best Practices, Council of Graduate Schools
References
National Science Foundation, National Center for Science and Engineering Statistics. 2015. Doctorate Recipients from US Universities: 2014. Special Report NSF 16, Arlington, VA. Available at http://www.nsf.gov/statistics/2016/nsf16300/
Okahana, H., & Allum, J. (2015). International graduate applications and enrollment: Fall 2015. Washington, DC: Council of Graduate Schools.
Allum, J., & Okahana, H. (2015). Graduate enrollment and degrees: 2004 to 2014. Washington, DC: Council of Graduate Schools.
Pressing Issues in 2016
In February of 2016, the Council of Graduate Schools (CGS) launched its annual Pressing Issues Survey which asked graduate deans at member institutions to identify the three most important or “pressing” issues or challenges they currently face. The findings from this survey not only inform the graduate community about the concerns of graduate deans, but also help shape sessions at the CGS Summer Workshop and Annual Meeting. These insights provide impetus for new CGS best practices projects and research initiatives.
The 2016 CGS Pressing Issues Survey was sent to 489 U.S. colleges and universities that were members of CGS as of January 2016. A total of 192 institutions responded to the survey, for a response rate of 39%. Recruitment, admissions, and enrollment management topped the list as the most pressing issue for graduate deans, followed closely by student financial support. Graduate school financing was ranked third with promoting diversity and inclusion and promoting career preparation of students and professional development tied for fourth.
The top pressing issue identified by almost one-half (46%) of graduate deans in the survey was recruiting students, enrollment management, etc. (see Table 1). This was a top pressing issue for master’s-focused and specialized institutions (60%) and the second most pressing issue for doctoral institutions (36%). Recruiting students, enrollment management, etc. was a top issue for private, not-for-profit institutions (58%) and the second most pressing issue for public institutions (42%).
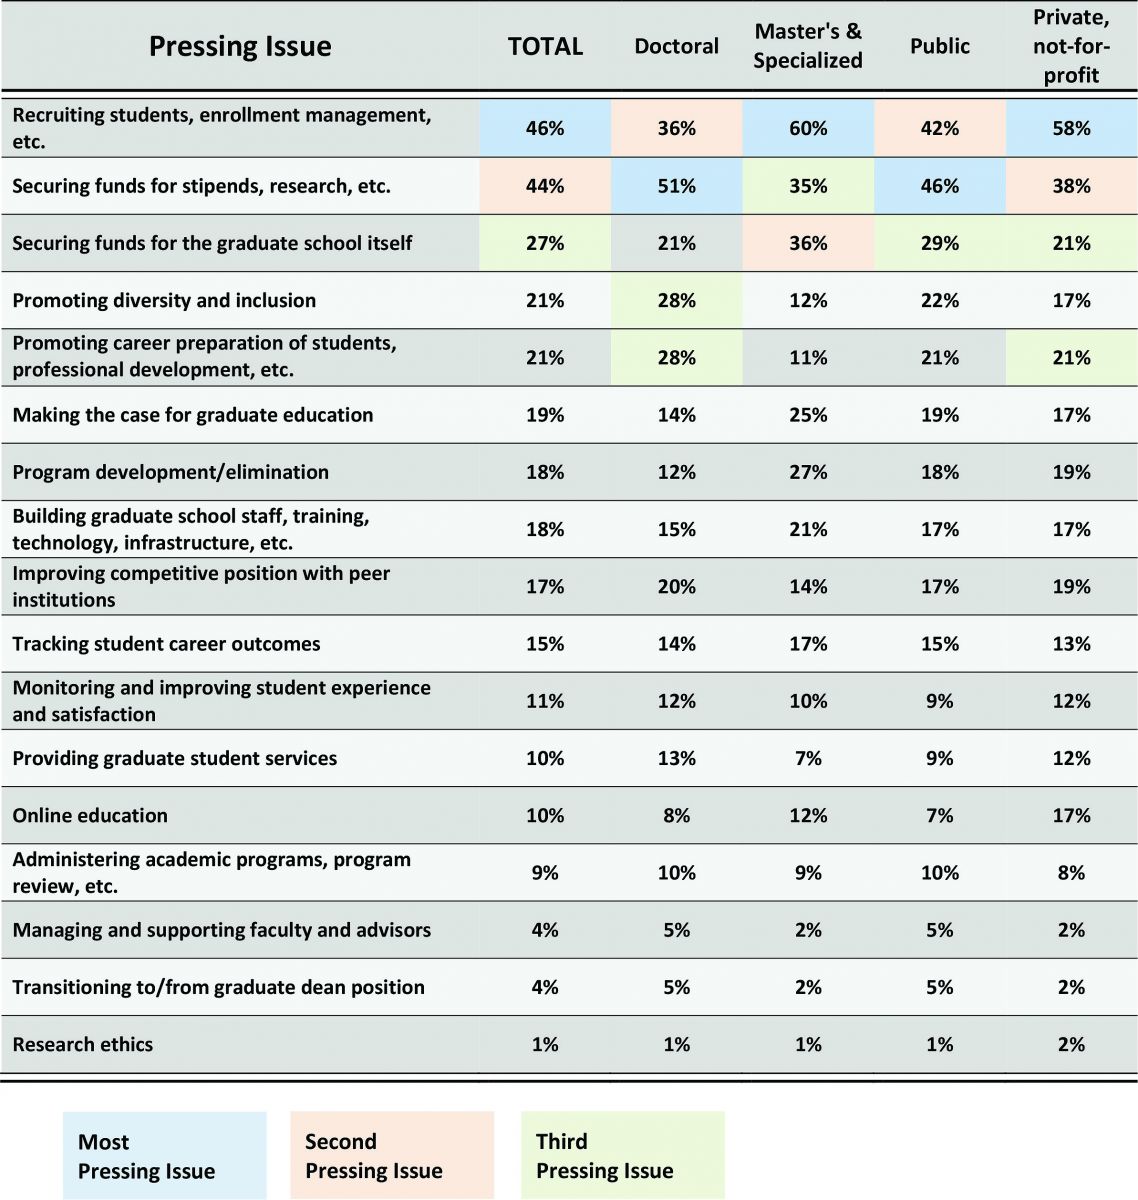
Securing funds for stipends, research, etc. was the second most commonly mentioned pressing issue overall, with 44% of all respondents indicating this as an issue. This was the top pressing issue at doctoral institutions (51%) and the second most pressing issue at master’s focused and specialized institutions (35%). This was also the top pressing issue for graduate deans at public institutions (46%), and the second most pressing issue for their counterparts at private, not-for-profit institutions (38%).
Securing funds for the graduate school itself ranked third (27%) among the most pressing issues of graduate deans in early 2016. Graduate program financing was also the third top pressing issue among graduate deans at master’s-focused and specialized institutions (36%), but the fifth most pressing issue for their counterparts at doctoral institutions (21%). This was the third top pressing issue among public institutions (29%) and was tied for the third most pressing among private, not-for-profit institutions (21%).
Promoting diversity and inclusion and promoting career preparation of students, professional development, etc. tied for the fourth most pressing issue in the beginning of 2016 (21%). These were also both the fourth most pressing issues among graduate deans at doctoral institutions (28%). At the master’s-focused and specialized institutions, promoting diversity and inclusion tied as the ninth pressing issue (12%), with promoting career preparation follow closely behind in eleventh place (11%). Promoting diversity and inclusion was the fourth most pressing issue among public institutions (22%) while it was tied with four other issues as the seventh most pressing issue (17%) for private, not-for-profit institutions.
Pressing Issues in the Last Five Years
This is the fifth consecutive year where recruitment, admissions, and enrollment management; graduate student financing; and graduate program financing have all been reported as the top three pressing issues currently facing graduate deans. Over the last two years, there has been a shift in the top pressing issue. For both 2015 and 2016 the top pressing issue reported is recruitment, admissions, and enrollment management while for the previous two years, 2013 and 2014, graduate student financing was reported as the top pressing issue (see Table 2). Holding steady for the last five years, graduate program financing continues to be the third pressing issue reported by graduate deans.
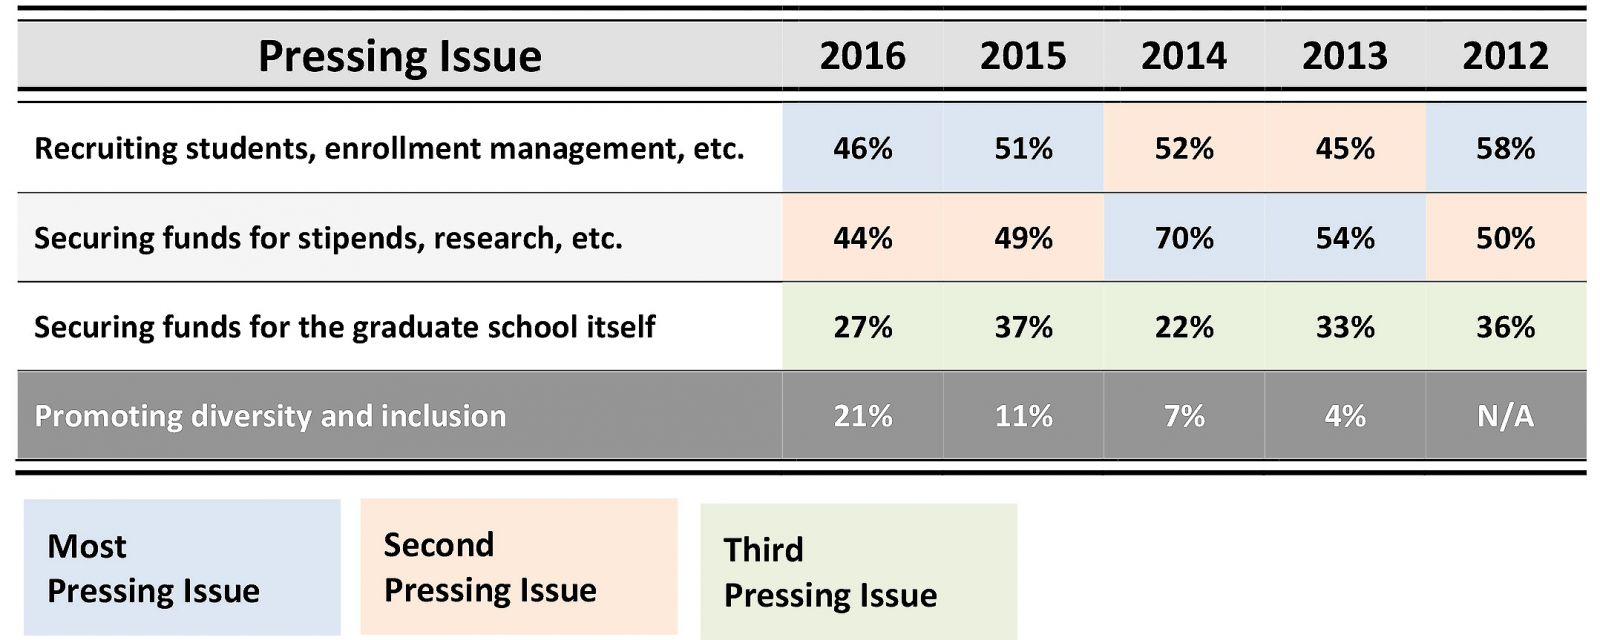
An interesting trend that warrants further examination is that promoting diversity and inclusion has emerged as a new top pressing issue for 2016. This issue which has gradually been gaining momentum over the past five years, tied as the fourth pressing issue for 2016 (21%). The past several years saw minimal increases with this issue ranking as the 14th pressing issues in 2013 (4%), the 13th issue in 2014 (7%), and the 10th pressing issue in 2015 (11%). Finally, promoting diversity and inclusion broke the top five this year to be the fourth most pressing issue.
By Jeff Allum, Assistant Vice President, Research and Policy Analysis and K. Stone, Program Manager, Best Practices, Council of Graduate Schools
![]()