

Thank you for visiting CGS! You are currently using CGS' legacy site, which is no longer supported. For up-to-date information, including publications purchasing and meeting information, please visit cgsnet.org.
Benchmarking

CGS is the leading source of information, data analysis, and trends in graduate education. Our benchmarking data help member institutions to assess performance in key areas, make informed decisions, and develop plans that are suited to their goals.
U.S. graduate schools continue to draw growing numbers of prospective students from other nations.
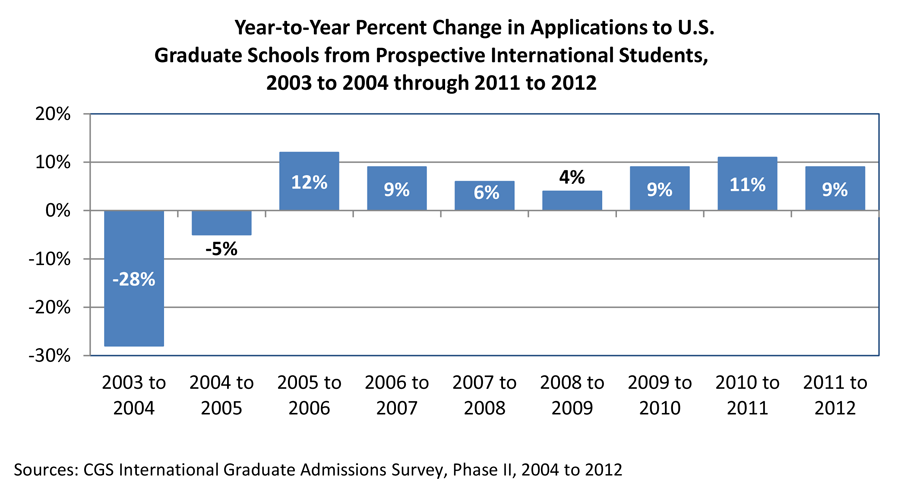
According to respondents to the 2012 CGS International Graduate Admissions Survey, Phase II: Final Applications and Initial Offers of Admission (Bell, 2012), applications to U.S. graduate schools from prospective international students increased by 9% between 2011 and 2012, the seventh consecutive year in which applications from prospective international graduate students has grown (see Figure 1).
The CGS Graduate Enrollment and Degrees report, published annually since 1986, presents the findings of the CGS/GRE Survey of Graduate Enrollment and Degrees, is a joint project of the Council of Graduate Schools and the Graduate Record Examinations (GRE) Board.
The latest report, Graduate Enrollment and Degrees: 2010 to 2020, includes more than 100 figures and data tables, as well as interpretative text, on applications for admission to graduate school, first-time and total graduate student enrollment, and graduate degrees and certificates conferred. Current year and trend data are presented by broad field, gender, race/ethnicity, citizenship, attendance status, institutional characteristics, and more.
Access the report
The current survey report is available to the public online:
Graduate Enrollment and Degrees: 2010 to 2020
Appendix B: Data Tables, Fall 2020 Data
Appendix C: Data Tables, Trends between 2010 and 2020
Appendix D: Taxonomy of Fields of Study
Downloadable Figures and Data Tables
Graduate Enrollment and Degrees Report by Fine Field: 2010 to 2020 (Members Only)
Press Release for the 2020 Report
CGS Webinar: Findings from the 2020 CGS/GRE Survey of Graduate Enrollment and Degrees (Oct. 19) - Recording and presentation slides
Historical reports
Reports dating back to 2006 are available free online to administrators, faculty, and staff members of CGS member institutions. Visit the CGS Member Library to view, print or download PDFs of past reports of the Graduate Enrollment and Degrees survey.
Contact
For more information about the CGS/GRE Survey of Graduate Enrollment and Degrees, please contact Enyu Zhou.
The complete survey report, Graduate Enrollment and Degrees: 2001 to 2011, is available below. This year's survey was sent to a total of 788 colleges and universities, and usable responses were received from 655 institutions, for an overall response rate of 83%. The responding institutions confer about 74% of the 688,000 master's degrees and 91% of the 69,000 doctorates awarded each year by U.S. colleges and universities.
The CGS/GRE Survey of Graduate Enrollment and Degrees is the only national survey that collects data on first-time and total graduate enrollment by field across all fields of graduate study. It is also the only source of data on graduate enrollment by degree level (master's versus doctoral) and the only national survey that collects data on applications to graduate school by field of study.
Information by broad field is publicly available here. CGS members also have access to a special online report, which includes data by fine field of study.
Click below to view the report. To print or download a PDF of the complete report, create a user account (free) at Issuu.com.
Contact:
Julia Kent
jkent@cgs.nche.edu
(202) 223-3791
Washington, DC — The Council of Graduate Schools (CGS) reported today that U.S. graduate schools saw a 1.7% dip in enrollments of first-time graduate students between fall 2010 and fall 2011, marking the second consecutive year of slight decreases. Across the board, graduate school enrollments remain ahead of where they were a decade ago, but the latest figures reverse increases for the 2007-08 and 2008-09 academic years, when enrollments grew 4.5% and 5.5% respectively. These findings are the result of the CGS/GRE Survey of Graduate Enrollment and Degrees, an annual survey that has been conducted since 1986.
First-time enrollment in master’s and certificate-level programs declined 2.1% between fall 2010 and fall 2011, while doctoral degree programs enrolled 0.5% more new students during the same time period. Overall, according to survey respondents, more than 441,000 students began graduate studies in fall 2011.
The study also highlights an apparent gap between the aspirations of prospective graduate students and the realities of graduate enrollment: despite the overall decline in first-time enrollments, interest in pursuing graduate degrees remains high and continues to grow. The report showed a 4.3% bump in applications for admission to graduate programs between fall 2010 and fall 2011. Institutions that participated in the annual survey reported receiving nearly 1.88 million applications across all fields of study leading to master’s or doctoral degrees and graduate certificates. Engineering, business, and social and behavioral sciences accounted for the largest numbers of graduate applications in 2011.
CGS President Debra Stewart observed that the gap between growing applications and dropping enrollments should be seen as a call to action. “Graduate education is a cornerstone of a thriving, highly-skilled workforce, and a graduate degree holds out lifetime benefits for individual students. The 4.3 percent increase in application numbers reveals that students are eager to attend graduate school. While the 1.7 percent decrease in first-time enrollment is not dramatic, the fact that we are now in the second year of reversed growth is a sign that we must respond with strong investments in graduate programs and student funding.”
The report presents statistics on graduate applications and enrollment for fall 2011, degrees conferred in 2010-11, and trend data for one-, five- and ten-year periods. Data are disaggregated for a number of student demographic and institutional characteristics. Other findings include:
First-time graduate enrollment
Total graduate enrollment
Graduate degrees and certificates awarded
Graduate Enrollment and Degrees: 2001 to 2011 presents the findings of an annual survey of U.S. graduate schools, co-sponsored by CGS and the Graduate Record Examinations (GRE) Board. It is the only annual national survey that covers enrollment in all fields of graduate study and is the only source of national data on graduate applications. The report includes responses from 655 institutions, which collectively confer about 81% of the master’s degrees and 92% of the doctorates awarded each year.
The Council of Graduate Schools (CGS) is an organization of over 500 institutions of higher education in the United States and Canada engaged in graduate education, research, and the preparation of candidates for advanced degrees. Among U.S. institutions, CGS members award 92% of the doctoral degrees and 81% of the master’s degrees.* The organization’s mission is to improve and advance graduate education, which it accomplishes through advocacy in the federal policy arena, research, and the development and dissemination of best practices.
* Based on data from the 2011 CGS/GRE Survey of Graduate Enrollment and Degrees
Contact:
Julia Kent
jkent@cgs.nche.edu
(202) 223-3791
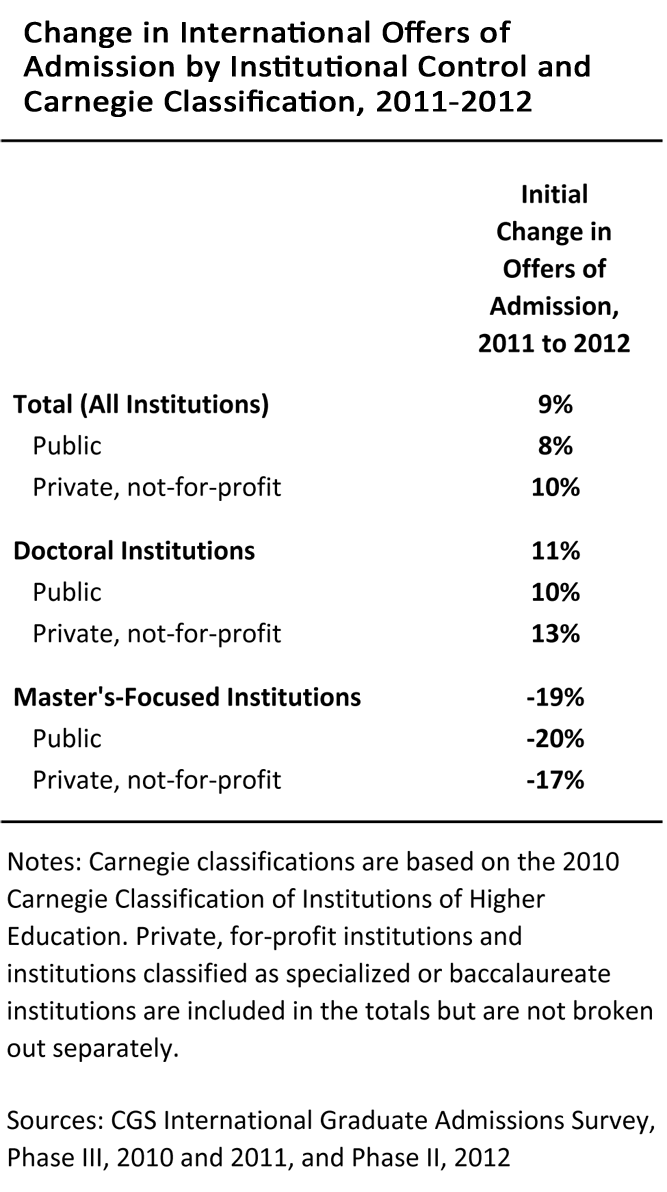
Washington, D.C. ̶ The Council of Graduate Schools is reporting that offers of admission from U.S. graduate schools to prospective international students increased 9% from 2011 to 2012, following an increase of 9% last year. The new data marks the 3rd consecutive year of growth in international graduate admissions.
The survey report on admissions trends, released today, shows that this growth was driven substantially by a 20% increase in offers of admission to prospective students from China, the seventh year in a row of double-digit increases. Offers of admission to students from the Middle East rose 17%, marking the fifth year of significant growth, and offers of admission to Brazilian students rose 13%. However offers of admission to students from India and South Korea, the second and third largest sending countries of international students to U.S. graduate programs respectively, stayed flat.
CGS President Debra W. Stewart remarked that the overall pattern of growth in applications and admission shows that overseas students continue to recognize the quality of the U.S. graduate education system. “U.S. graduate programs and institutions still enjoy a world-class reputation.” At the same time, Stewart cautioned that growth beyond 2012 remains uncertain. “Given the current global economy and increasing global competition for talent, we must continue our efforts to attract students from countries where numbers of student applicants are slowing, as well as those such as Brazil and China, where there is renewed momentum to pursue graduate study in the U.S.”
Admissions trends by field
The survey results show that offers of admission increased in all broad fields of study except the life sciences, where numbers of admissions remained flat. Business and Education saw the largest increases in admissions offers, increasing 17% in both fields. Strong gains were also seen in social sciences and psychology (14%), ‘other’ fields (9%), and engineering (7%), followed by more modest growth in the arts & humanities (6%) and physical and earth sciences (5%). This is the second year of double-digit growth for international admissions to Business programs, following a 11% gain in 2011.
Admissions trends by Institution Size
Large institutions (in terms of the number of graduate degrees awarded to international students) continue to drive more of the growth in international offers of admission than those awarding smaller numbers of degrees to international students. Respondents from the larger institutions showed somewhat larger increases on average: 16% at the 10 largest and 10% at the 100 largest, as compared with a 6% increase at the institutions outside the largest 100.
Admissions trends by region
As was the case last year, offers of admission by U.S. graduate schools to prospective international students increased in all four major regions of the United States. The Northwest saw the most growth (11%), followed by the Midwest, the South, and the West, all with an 8% gain.
Comparison of applications and admissions trends
In addition to admissions trends, the report also tracks applications. This year the increases in applications matched the increases in offers of admission, both at 9%. The survey found a final 9% increase in international graduate applications for fall 2012, with large increases in applications from China (19%), the Middle East (11%), and Mexico (10%).
About the report
Findings from the 2012 CGS International Graduate Admissions Survey, Phase II: Final Applications and Initial Offers of Admission is based on the second phase of a three-part annual survey of international graduate student applications, admissions, and enrollment among U.S. member institutions. The survey had a response rate of 44%, including 76 of the 100 institutions that award the largest number of graduate degrees to international students. The report is posted at www.cgsnet.org.
The Council of Graduate Schools (CGS) is an organization of over 500 institutions of higher education in the United States and Canada engaged in graduate education, research, and the preparation of candidates for advanced degrees. Among U.S. institutions, CGS members award 92% of the doctoral degrees and 77% of the master’s degrees.* The organization’s mission is to improve and advance graduate education, which it accomplishes through advocacy in the federal policy arena, research, and the development and dissemination of best practices.
* Based on data from the 2010 CGS/GRE Survey of Graduate Enrollment and Degrees
Interdisciplinary study has long been a feature of graduate education and research, but measuring the scope and determining the nature of interdisciplinarity has proven a challenge for survey researchers. Three major data collection efforts on graduate education—the CGS/GRE Survey of Graduate Enrollment and Degrees, the U.S. Department of Education’s Integrated Postsecondary Education Data System (IPEDS), and the National Science Foundation’s Survey of Graduate Students and Postdoctorates in Science and Engineering—use taxonomies of fields of study to collect and analyze enrollment and degree data. While this is an efficient method for characterizing enrollment and degrees in programs of study that are based in a single discipline, it is somewhat less effective for measuring interdisciplinarity.
IPEDS’ Classification of Instructional Programs (CIP) places all multidisciplinary and interdisciplinary programs under a single CIP code. Similarly, the CGS/GRE Survey of Graduate Enrollment and Degrees also groups most interdisciplinary programs together under a single code. The Survey of Graduate Students and Postdoctorates in Science and Engineering reports data on interdisciplinary programs in an “other sciences” category. The classification systems used by these three surveys enable researchers to collect and report data on enrollment and degrees, but they mask some of the diversity that exists among and between interdisciplinary programs. These systems provide a count of the total number of students enrolling in or earning degrees from interdisciplinary programs, but in many cases do not permit an in-depth examination of the fields of study included in the interdisciplinary programs. In addition, these methods of classification provide an undercount of the true extent of interdisciplinarity in graduate education, since individual students in programs that are not considered interdisciplinary may in fact be conducting research that is interdisciplinary.
A fourth data source, the Survey of Earned Doctorates, uses a slightly different method than the three previously mentioned surveys to measure interdisciplinarity. The survey is administered to all doctoral students as they are about to complete their degrees. Individuals completing the survey are asked to select the primary field of their dissertation research from a provided list of fields of study, of which “interdisciplinary” is not an option. Then, a follow-on question asks doctorate recipients whether their dissertation research was interdisciplinary, and if so, to indicate a secondary field of study. By collecting data directly from students about their research, as opposed to collecting data from institutions about their programs, the Survey of Earned Doctorates is able to provide a different picture of interdisciplinarity at the doctoral level.
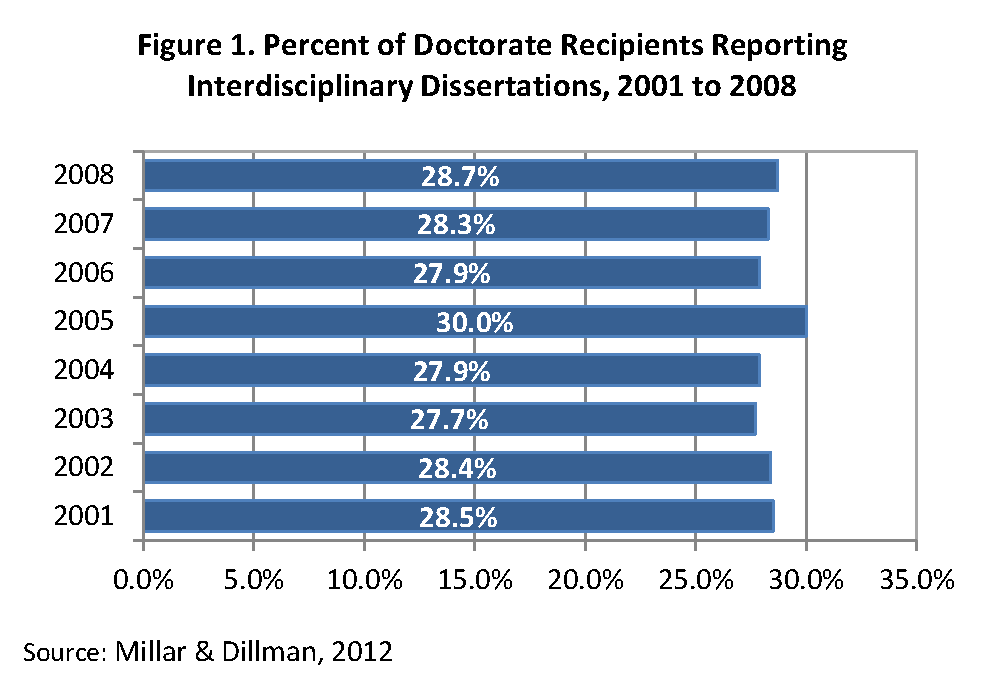
Using data from the Survey of Earned Doctorates, a recent report from the National Science Foundation examined trends in interdisciplinary dissertation research among individuals earning research doctorates between 2001 and 2008 (Millar & Dillman, 2012). The researchers found that 28.4% of all doctorate recipients in this time period reported that their dissertations were interdisciplinary in nature. The percentage of doctorate recipients reporting interdisciplinary dissertations remained relatively consistent over this eight-year period, as shown in Figure 1.
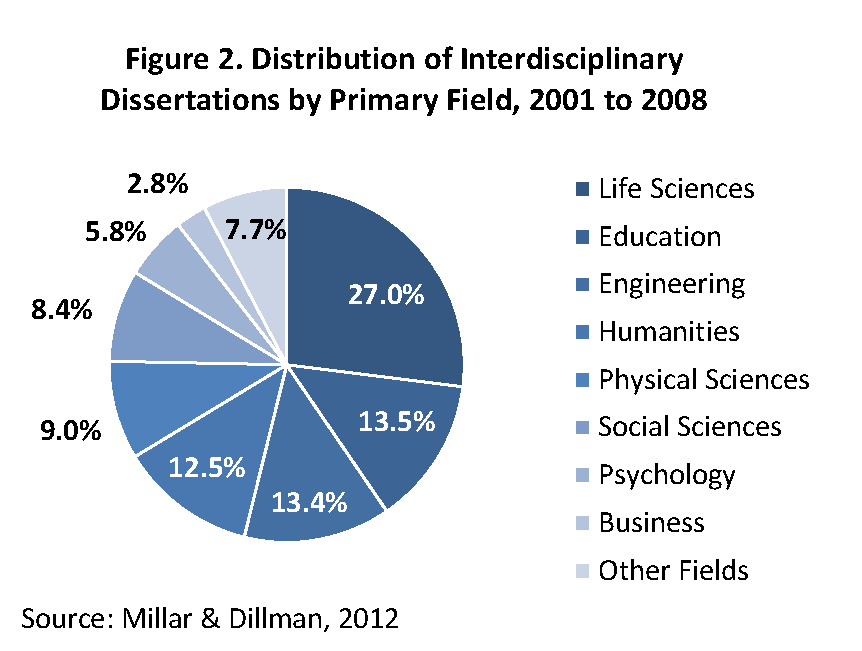
Doctorate recipients who reported their primary dissertation field as life sciences accounted for the largest share (27.0%) of all interdisciplinary dissertations between 2001 and 2008, as shown in Figure 2. Dissertations in education and engineering accounted for 13.5% and 13.4%, respectively, of all interdisciplinary dissertations. Dissertations in mathematics, computer sciences, and communications accounted for very small shares of all interdisciplinary dissertations and are included in the “other fields” category in Figure 2.
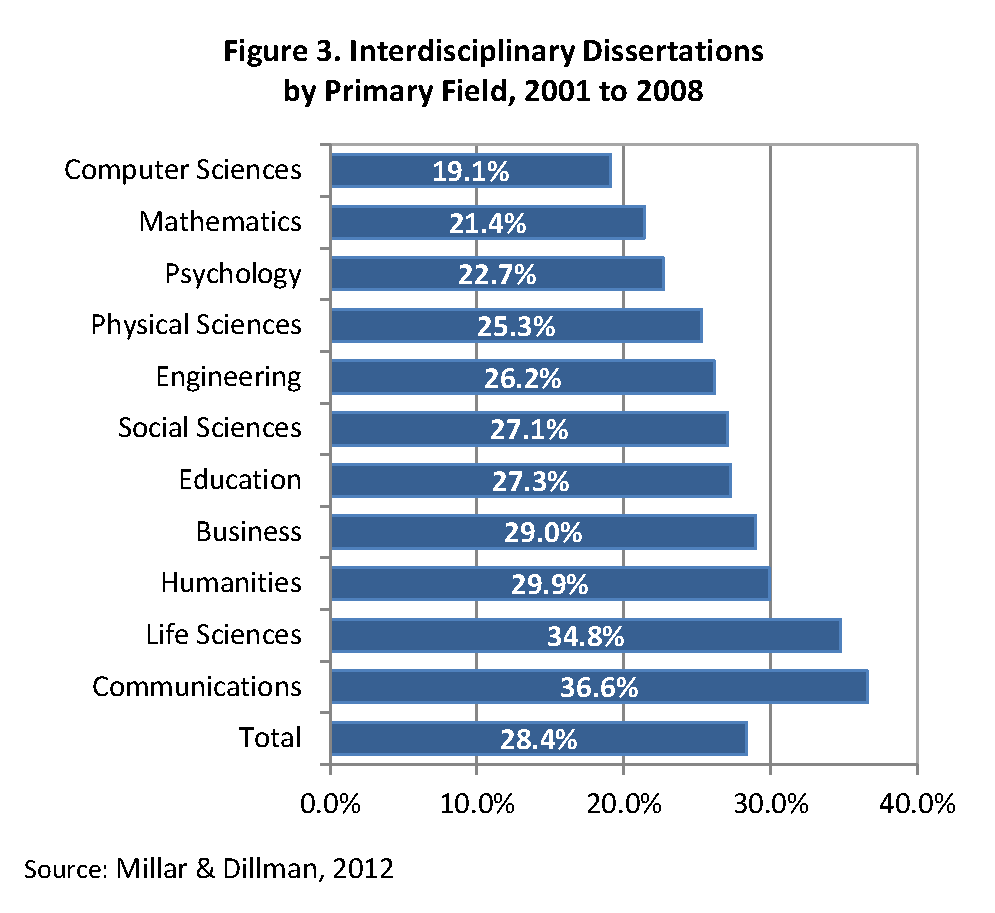
Splicing the data in a different way, Millar and Dillman examined the percent of all dissertations within a primary field that were interdisciplinary. They found that dissertations in communications were most likely to have been interdisciplinary. Between 2001 and 2008, 36.6% of doctorate recipients in communications reported that their dissertations were interdisciplinary in nature. A large share of doctorate recipients in life sciences also reported interdisciplinary dissertations. Doctorate recipients in computer sciences and mathematics were least likely to report interdisciplinary dissertations.
While Millar and Dillman did not examine trends in interdisciplinarity by student demographics, other research has indicated that women participate in interdisciplinary research at higher rates than their male counterparts (Rhoten & Pfirman, 2007). Additional analyses of the data from the Survey of Earned Doctorates could empirically document the extent to which interdisciplinarity differs by gender, citizenship, and race/ethnicity.
Millar and Dillman’s examination of interdisciplinarity provides good insight into the scope of interdisciplinary research in doctoral dissertations. They do suggest in their research—and graduate deans would likely agree—that some differences may exist between how students define interdisciplinarity and how institutions and graduate programs define interdisciplinarity. Despite these potentially differing definitions, it is clear that interdisciplinarity is an established component of graduate education.
By Nathan E. Bell, Director, Research and Policy Analysis, Council of Graduate Schoools
References:
Millar, M. M. & Dillman, D. A. (2012). Trends in interdisciplinary dissertation research: An analysis of the Survey of Earned Doctorates. Retrieved from www.nsf.gov/statistics/ncses12200/
Rhoten, D. & Pfirman, S. (2007). Women in in interdisciplinary science: Exploring preferences and consequences. Research Policy, 36, 56-75.
The Computing Research Association’s Data Buddies project gathers data on undergraduate and graduate students from a sample of computing departments nationwide. Two waves of surveys so far have helped improve evaluation of several broadening participation programs by developing a comparison group of nonparticipating students; in addition, the responses are a rich source of data on students’ decisions about graduate school and research careers.
Betsy Bizot, Kenneth Hines, and Delicia Mapp, Computing Research Association
The article, “Dwindling numbers, tough challenges,” published in China Daily USA cited CGS’ data on the growth in the numbers of Chinese students seeking admission to higher education institutions in the United States.
This article examines the impact of cuts to the Ronald E. McNair program’s funding on the numbers of ethnic minorities who earn doctoral degrees. The Council of Graduate Schools/Council for Opportunity in Education’s Joint McNair Committee’s data were cited.
Student loan debt in the United States is at a record high. In February 2012, the Federal Reserve Bank of New York released data indicating that student loan debt reached $867 billion in the fourth quarter of 2011, exceeding the $704 billion Americans owed in credit card debt (Federal Reserve Bank of New York, 2012). The Consumer Financial Protection Bureau puts the student loan debt figure even higher, reporting in March 2012 that student loan debt is estimated to exceed $1 trillion (Consumer Financial Protection Bureau, 2012). While the exact amount owed in student loans may be in question, it is clear that Americans collectively owe a tremendous amount of money in student loans.
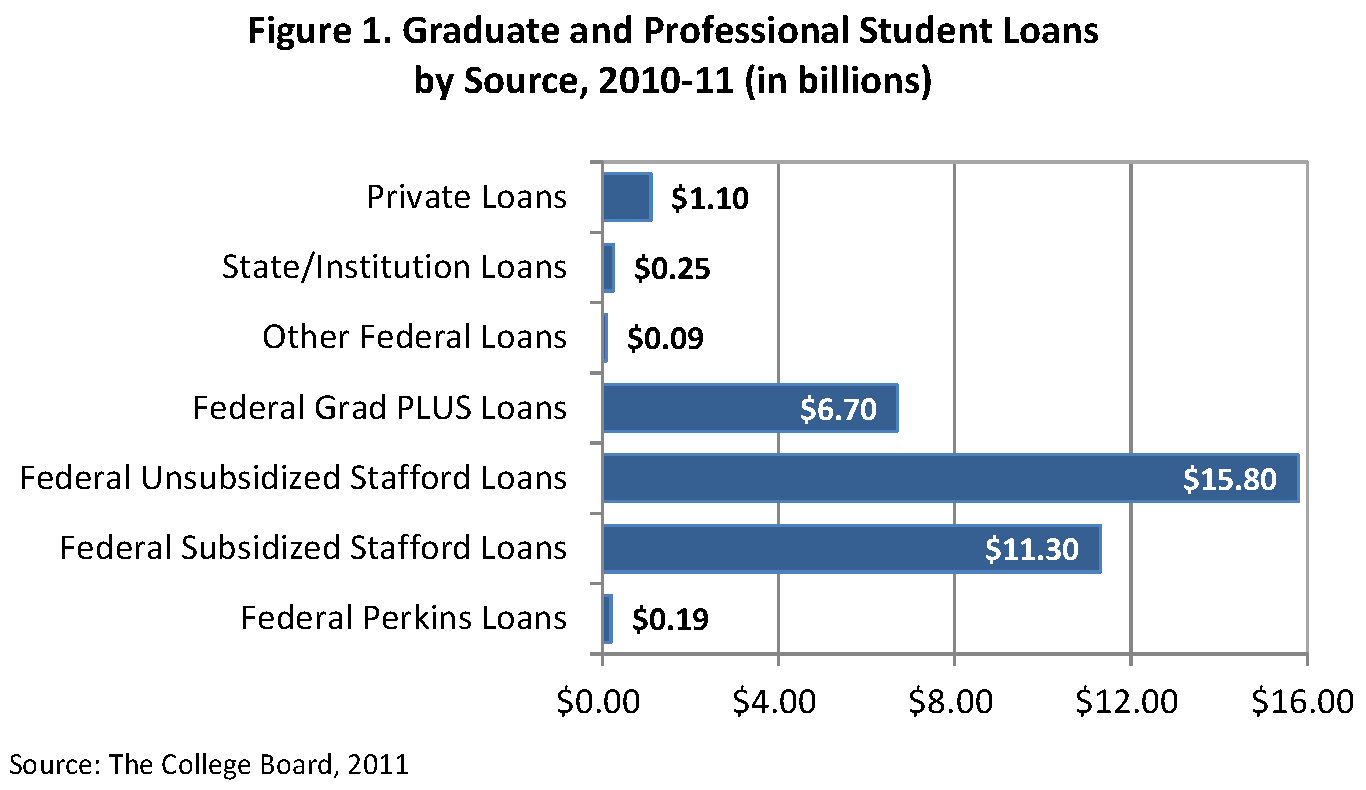
In academic year 2010-11 alone, students took out an estimated $112 billion in student loans, with graduate and professional students accounting for more than $35 billion of the total (The College Board, 2011). The majority of the student loans taken out by graduate and professional students in 2010-11 ($34 billion) came from the federal government, most commonly in the form of unsubsidized and subsidized Stafford loans, as shown in Figure 1.
Over time, graduate students have become increasingly reliant on student loans to finance their education. According to The College Board, graduate and professional students received an average of about $6,750 in non-loan financial support and about $16,400 in federal student loans per FTE student in academic year 2010-11. When comparing these figures to those from 2000-01, graduate and professional students received 19% more in non-loan financial support per FTE in 2010-11 than they did a decade earlier (after adjusting for inflation), but they borrowed 75% more per FTE in federal student loans.
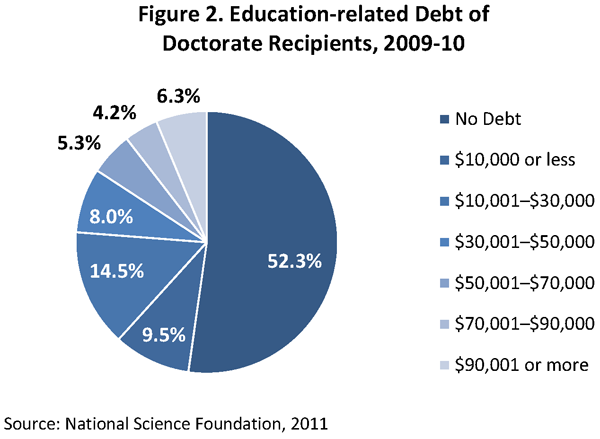
About half of all doctorate recipients now graduate with debt. According to the National Science Foundation (NSF), individuals earning research doctorates in academic year 2009-10 did so owing over $20,400 on average in education-related debt, of which about $14,100 on average was graduate debt and about $6,400 on average was undergraduate debt (National Science Foundation, 2011). While 52% of all research doctorate recipients graduated with no debt, 16% did so owing more than $50,000 in combined undergraduate and graduate debt (Figure 2).
While NSF’s data indicate that only about 48% of doctorate recipients graduate with education-related debt, their data only include individuals earning research doctorates. Data from the U.S. Department of Education’s National Postsecondary Student Aid Study (NPSAS), which includes students earning research doctorates as well as those earning professional and practice-oriented doctorates (such as the Ed.D.), put the figure slightly higher. Among individuals earning doctorates in academic year 2007-08 (the latest year for which data are available from the NPSAS), 56% did so with undergraduate and/or graduate debt, and those with debt owed nearly $59,000 on average (National Center for Education Statistics, 2009). (Note that NSF’s $20,400 average debt burden is for all doctorate recipients while the $59,000 figure from the NPSAS is only for those doctorate recipients with debt, meaning that these are not direct comparisons.) Individuals earning master’s degrees in 2007-08 were even more likely to graduate with debt; 69% had undergraduate and/or graduate student loans, with those with loans owing more than $40,000 on average. Overall, 2% of master’s graduates and 13% of doctorate recipients in 2007-08 graduated with $80,000 or more in student loan debt.
When the NPSAS data are disaggregated by citizenship and race/ethnicity, it becomes clear that debt is not evenly distributed. Among doctorate recipients in 2007-08, 71% of U.S. citizens graduated with undergraduate and/or graduate debt, compared with just 25% of permanent residents, and 15% of non-U.S. citizens on temporary visas. Among master’s degree recipients in 2007-08, 74% of U.S. citizens graduated with debt, compared with 52% of permanent residents, and 31% of non-U.S. citizens on temporary visas.
Among U.S. citizens and permanent residents, African Americans are most likely to graduate with debt. At the doctoral level, 85% of African American graduates in 2007-08 had debt, compared with 72% of Whites, 47% of Hispanics, and 40% of Asians. At the master’s level, 87% of African American graduates in 2007-08 had debt, compared with 82% of Hispanics, 70% of Whites, and 61% of Asians. Not only are African Americans most likely to graduate with debt, but those with debt owe more on average than their peers of other races/ethnicities. African American doctorate recipients in 2007-08 with debt owed more than $68,000 on average upon graduation, compared with about $60,000 for both Hispanics and Whites. At the master’s level, African Americans with debt owed nearly $52,000 on average, compared with about $46,000 for Hispanics and $38,000 for Whites.
While many graduate students, particularly those in the sciences and engineering, complete graduate school with little or no debt, the data indicate that a growing number of graduate students are not that fortunate. The increased reliance on student loans to finance graduate education, combined with the elimination of subsidized Stafford loans for graduate students, increases in tuition and fees, and decreasing or stagnant support for higher education in many states suggest that debt levels will continue to rise. Many graduates are already entering the workforce saddled with debt that exceeds their annual salaries, and without changes to existing financial aid policies, more graduates will be in this position.
The federal government, state governments, universities, and businesses need to work together to help students earn advanced degrees without incurring massive debt. The recent CGS/ETS report, Pathways Through Graduate School and Into Careers, provides several recommendations to reduce the debt burden of graduate students. For example, the report recommends the implementation of tax policies that encourage employer-provided assistance for graduate study, a COMPETES doctoral traineeship program, and a new Integrative Graduate Humanities Education and Research Training (IGHERT) program, among other recommendations (Wendler et al., 2012). The global competitiveness of the United States and our capacity for innovation depend on individuals with graduate degrees. In order to ensure the future success of this nation, we must address the issue of student debt to guarantee that the workforce of the future includes adequate numbers of individuals with graduate degrees.
By Nathan E. Bell, Director, Research and Policy Analysis, Council of Graduate Schools
References:
The College Board. (2011). Trends in Student Aid 2011.
Consumer Financial Protection Bureau. (2012). “Consumer Financial Protection Bureau Releases Financial Aid Comparison Shopper.”
Federal Reserve Bank of New York. (2012). Quarterly Report on Household Debt and Credit.
National Center for Education Statistics. (2009). 2007-08 National Postsecondary Student Aid Study. Dataset.
National Science Foundation. (2011). Doctorate Recipients from U.S. Universities: 2010. Retrieved from http://www.nsf.gov/statistics/sed/
Wendler, C., Bridgeman, B., Markle, R., Cline, F., Bell, N., McAllister, P., and Kent, J. (2012). Pathways Through Graduate School and Into Careers. Princeton, NJ: Educational Testing Service.
![]()